At a glance
- Category
- An experimental research memorandum that proposes a new airfoil concept, explains the reasoning behind its shape, and backs it with two-dimensional wind-tunnel data. In the authors' words, the shape was arrived at on the basis of intuitive reasoning and substantiating experiment (p. 6), not by theory.
- Context
- By the early 1960s the usual ways to raise the drag-rise Mach number were to delay the critical Mach number with thinner sections, sweepback or area ruling, or to control shock-induced separation with special camber, vortex generators or blowing (pp. 1–2). The report cites H. H. Pearcey's work on shock-induced separation and its prevention (ref. 1) and uses NACA Report 824 to check its reference-airfoil drag (p. 14).
- Contributions
- A new section shape that tolerates a large region of supersonic flow at cruise lift: flat, low-curvature upper surface, negative camber ahead of a slot and strong positive camber behind it (pp. 3–10).
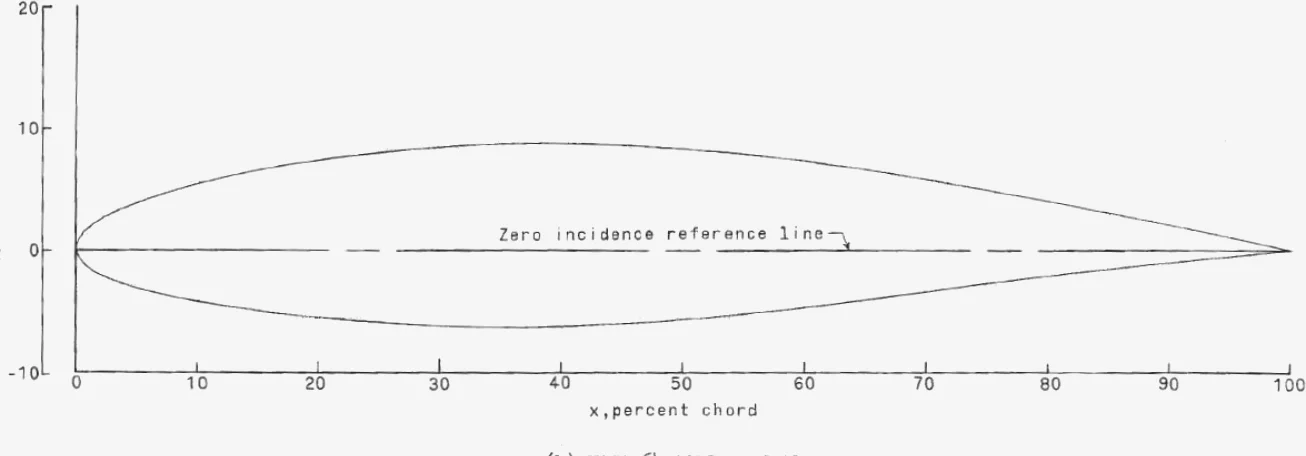
- Full ordinates of the 13.5-percent-thick supercritical airfoil, its slot and the NACA 64₂A215 reference (Tables I–IV).
- Measured drag rise at just above , against 0.67 estimated for a 13.5-percent 64A-series section: a gain of about 0.12, or 18 percent (pp. 15–16).
- Evidence, from pressures, schlieren photographs, oil flow and wake surveys, of a nearly shock-free recompression at the design point, which the authors call unexpected (p. 16).
- Higher stall normal force at high subsonic speeds than the reference section, alongside about 10 percent more drag below the rise and a much more negative pitching moment (pp. 17–19).
Summaryp. 1
An airfoil shape is proposed to push the subsonic drag rise well beyond the critical Mach number at cruise lift. It has a slot between the upper and lower surfaces near the trailing edge to delay shock-induced separation on both surfaces, negative camber ahead of the slot and substantial positive camber behind it to reduce shock losses (p. 1).
- Two-dimensional models of a 13.5-percent-thick supercritical airfoil and an NACA 64A-series reference were tested at Mach numbers from 0.65 to 0.80.
- At the design section normal-force coefficient of 0.65, drag rise came at for the new shape and 0.67 for the 64A-series section.
- Just below its drag rise, the new airfoil's drag is due almost entirely to skin friction and about 10 percent above the 64A-series value.
- Its pitching moment is substantially more negative, and its stall normal force at high subsonic speeds is significantly higher.
Introductionpp. 1–2
The economics of an aircraft cruising at high subsonic speed improve if the drag rise caused by local supersonic flow on the wing's upper surface can be delayed. The report sorts earlier methods into two approaches (p. 1):
- Delay the critical Mach number, the free-stream Mach number at which the local flow first reaches sonic speed: thinner sections, sweepback, area ruling and antishock bodies.
- Live with supersonic flow but prevent shock-induced separation, at supercritical Mach numbers: special camber, vortex generators, or blowing high-energy air into the boundary layer near the shock.
Each has a price. Sweepback cuts the aerodynamic aspect ratio for a given structural one, lowers usable landing lift and risks pitch-up. Boundary-layer blowing needs extra energy and complex piping, which had kept it off real airplanes (p. 2). The aim here is to delay drag rise for the usual cruise lift conditions by shaping alone, including a slot. Results for many variants were obtained, but to expedite publication only the most successful configuration is reported in detail, and only near design conditions. Off-design results come from a slightly different version (p. 2).
Symbolspp. 2–3
Forces come from summing measured surface pressures, and drag from a wake survey. With the pressure coefficient, and the free-stream static and dynamic pressures, measured along the airfoil reference line and the chord:
section normal-force coefficient, pitching moment about the quarter chord, section drag coefficient, point drag coefficient of one wake tube, vertical distance in the wake. l.s. and u.s. are the lower and upper surfaces. is the pressure coefficient at which the local Mach number is 1.0.
For the small angles of attack used, is approximately the lift coefficient (p. 15).
Basic Conceptspp. 3–6
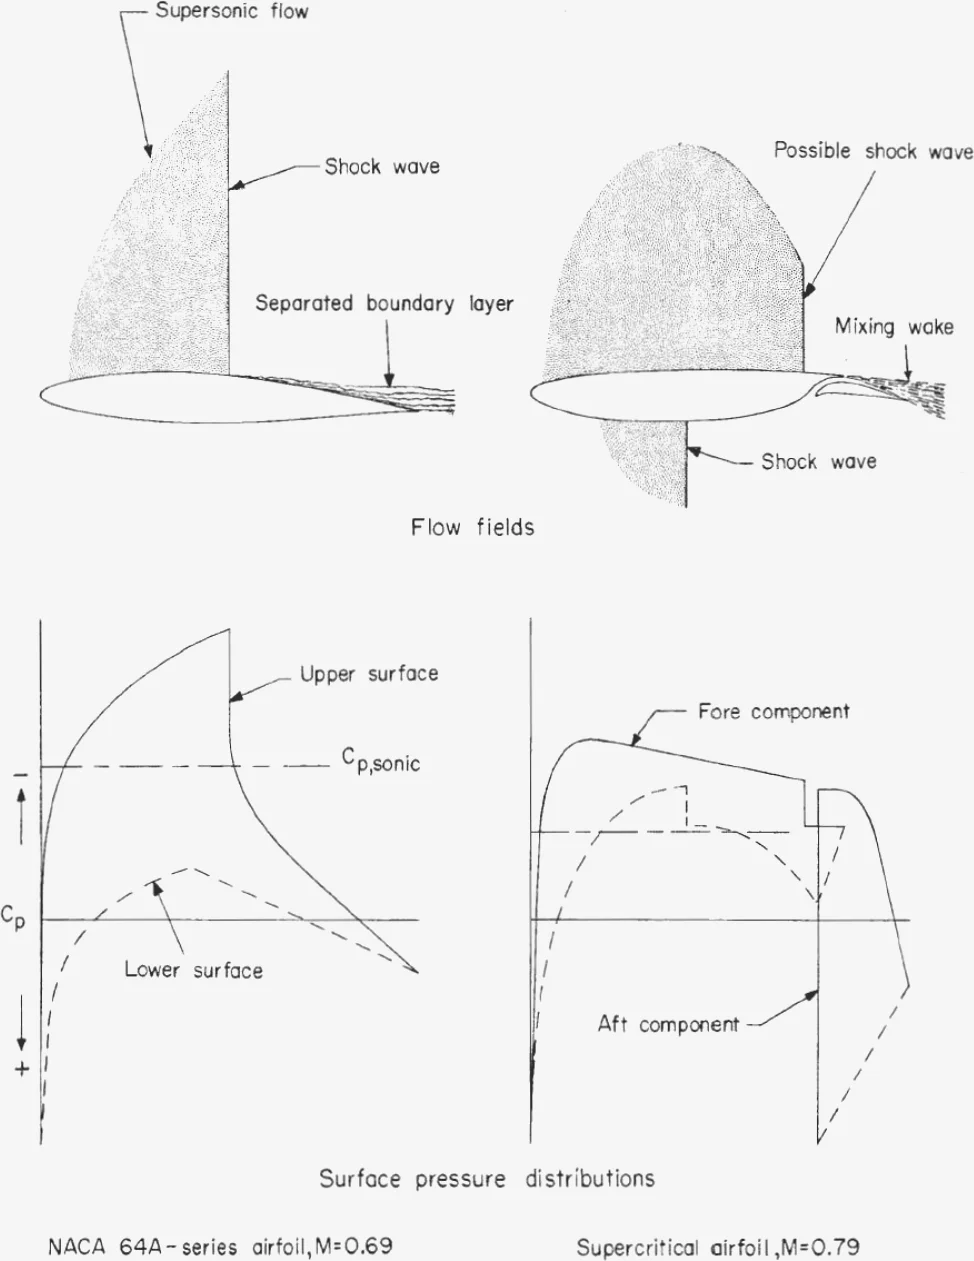
Even at moderate supercritical Mach numbers, a broad region of supersonic flow stands above the airfoil and usually ends in a shock wave. The shock costs energy directly, but more importantly its pressure rise can separate the boundary layer, with a large drag increase. At lifting conditions this happens first on the upper surface, and on the lower surface at higher Mach numbers (pp. 3–4). The report names the parts ahead of and behind the slot the fore and aft components.
Reduction of Tendency Toward Boundary-Layer Separationpp. 4–5
Upper surface. Separation begins because the low-momentum boundary layer cannot climb the shock's pressure rise on top of the normal subsonic recovery. The slot injects stream energy air under the upper boundary layer partway through that combined rise. The fore-component boundary layer climbs only the part ahead of the slot exit, then continues as an unconfined wake. Momentum mixes faster in a wake than in a turbulent boundary layer, so it can survive a larger total pressure rise without reversing, and the aft component starts a fresh boundary layer (p. 4).
If the shock moves behind the slot exit, the aft boundary layer must climb the whole rise alone, and the tendency to separate is greatly increased. The authors liken the slot to a high-lift slotted flap and to boundary-layer blowing, but with no extra energy or ducting (p. 4).
Lower surface. Placing the slot entrance partway along the lower-surface recovery acts like boundary-layer suction: the fore-component boundary layer climbs only part of the rise before entering the slot, where the low exit pressure keeps the gradient favourable (pp. 4–5).
Reduction of Shock Lossespp. 5–6
Modification of camber distribution. Once separation is suppressed, the shock moves aft, the Mach number ahead of it rises and the wave grows taller, so wave losses climb. To limit them, reduce the vertical extent of the supersonic region and the Mach number just ahead of the shock. That also slows the shock's rearward march, delaying the moment it passes the slot exit. Both follow from reducing the curvature and slope of the upper surface ahead of the shock (p. 5).
A flatter upper surface means less camber and less lift from the middle of the section. Some can be recovered by drooping the nose, but that hurts off-design high-lift behaviour. Instead, most of the missing lift is carried behind the shock, especially on the lower surface, by strong positive camber and incidence of the rear of the airfoil (pp. 5–6). NASA's later summary of its supercritical airfoils names the same ingredient: a substantial camber into the rear portion of the airfoil (SP-4529, p. 7).
How much does the Mach number ahead of the shock matter? For a normal shock the losses grow very steeply with that Mach number . The standard relations, with , give the static-pressure jump and the total-pressure ratio:
The total-pressure loss, , is what the wake rake measures as wave drag. It is about 0.1 percent at , 1.3 percent at 1.25 and 7 percent at 1.5. Local surface Mach number and pressure coefficient are linked isentropically: , which gives when .
Influence of the slot. These camber changes make separation more likely: a steeper recovery near the upper trailing edge, higher lower-surface velocities (an earlier lower-surface shock), and a sharper recovery at the reflex. The slot is what lets the camber changes be pushed further without separation (p. 6).
Development of Detailed Shapepp. 6–10
Groups in the United States were then developing method-of-characteristics procedures to design airfoils for a given transonic pressure distribution, but none had fully accomplished this objective (p. 6). So the shape was found by reasoning and experiment, aiming, in order, to: eliminate separation at the design below the Mach number at which the shock passes the slot exit; delay that event as far as possible, since preliminary tests showed it causes an abrupt, uncontrollable drag rise; minimise shock losses just below it; behave acceptably off design; and keep the extra skin friction small. These goals conflict, so the shape is a compromise (pp. 6–7).
Fore Componentpp. 7–8
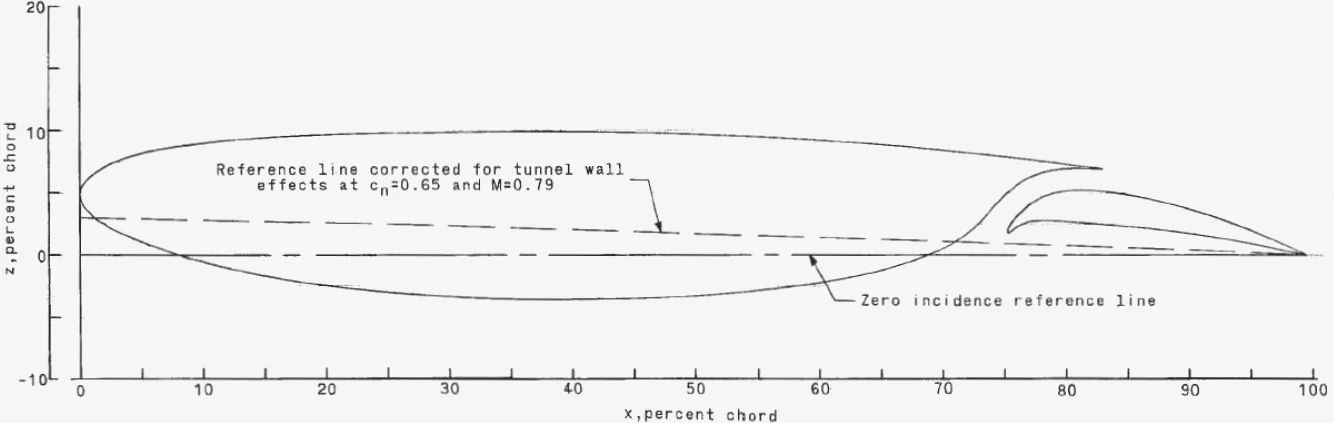
Upper surface. The pressure rise on the fore component's upper surface is limited to roughly that of the shock itself, by giving the rear of the surface only a small slope. The supersonic field is shaped to expand to a maximum over the middle of the fore component and then contract toward the shock, but not too fast: an over-rapid contraction concentrates compression waves near the surface, where they can merge into a stronger shock. The result is relatively small, roughly uniform, surface curvature and near zero mean slope from about 0.15c to the expected shock position near 0.75c, with the crest near 0.45c (p. 7).
The tested curvature is deliberately a little greater than the ideal, to limit the curvature needed on the lower surface. The extreme nose is shaped to keep pressure peaks down at subcritical high-lift conditions (pp. 7–8).
Lower surface. Preliminary tests showed that separation on the fore component's lower surface destroys the effectiveness of the slot and costs a lot of lift, so it must be delayed beyond the upper-surface drag rise. The surface is shaped for a long region of roughly constant suction, like the NACA 16-series, with a convex curve near the slot entrance so the pressure only recovers to the slot-entrance value, without overcompression (p. 8).
Aft Componentpp. 8–9
At high design lift, the aft component should give as much lift as upper-surface separation and structure allow. Unreported preliminary tests found the upper surface stays attached if it gives a reasonable pressure recovery and no more than slightly supersonic speeds above the fore-component wake; below the wake the flow can be substantially supersonic. Camber and incidence on the lower surface are limited by the component's thickness. Positive camber at its front prevents a suction peak near its nose, and its leading-edge radius is kept small to avoid disturbing the fore component's lower-surface recovery, though the size used (0.150 percent of chord) was chosen arbitrarily (pp. 8–9).
Slotpp. 9–10
Width. Wide enough that energetic slot air lies under the fore-component wake over the whole aft upper surface, but not so wide that the slot must be long. It was set so the fore-component wake and the aft boundary layer merge at about the trailing edge, roughly twice the fore-component lower-surface boundary-layer thickness at the exit. At these Mach numbers the flow is choked at the slot exit, so the entrance width must be very close to the exit width. The area variation was 6 percent; earlier tests at 4 and 8 percent made little difference (p. 9).
Curvature. A shorter slot means less skin friction, which needs tighter curvature, but tight curvature steepens the velocity gradient across the slot. Most of the slot's upper wall is a circular arc with the aft-component pivot near its centre, so incidence can change without disturbing the area distribution. Curvature is relaxed over about the last 1 percent of chord before the exit to avoid strong gradients or shocks. The fore component's trailing edge at the exit is thinned to about 0.0006c, with a minimum ratio of local thickness to distance from the exit of about 0.08, a value which should be structurally feasible (pp. 9–10).
| x | Fore upper z | Fore lower z | x | Aft upper z | Aft lower z | |
|---|---|---|---|---|---|---|
| 0 | 4.725 | 4.725 | 75.30 | 1.875 | 1.875 | |
| 1.00 | 6.375 | 3.200 | 75.75 | 2.875 | 2.075 | |
| 2.50 | 7.350 | 2.225 | 76.50 | 3.610 | 2.500 | |
| 5.00 | 8.175 | 1.050 | 78.00 | 4.575 | 2.800 | |
| 10.00 | 8.975 | −0.525 | 80.00 | 5.150 | 2.700 | |
| 15.00 | 9.375 | −1.675 | 81.25 | 5.250 | 2.575 | |
| 20.00 | 9.600 | −2.475 | 83.75 | 5.000 | 2.375 | |
| 30.00 | 9.825 | −3.375 | 86.25 | 4.575 | 2.125 | |
| 40.00 | 9.865 | −3.610 | 88.75 | 4.025 | 1.875 | |
| 50.00 | 9.675 | −3.300 | 91.25 | 3.365 | 1.550 | |
| 60.00 | 9.225 | −2.250 | 93.75 | 2.500 | 1.150 | |
| 65.00 | 8.850 | −1.250 | 96.25 | 1.500 | 0.625 | |
| 70.00 | 8.425 | 0.500 | 97.50 | 0.950 | 0.400 | |
| 75.00 | 7.910 | 4.800 | 98.75 | 0.360 | 0.150 | |
| 83.00 | 6.950 | 6.900 | 99.50 | 0 | 0 |
Leading-edge radius 1.500 (fore) and 0.150 (aft). The fore component's lower surface turns upward behind 67.5 percent chord to form the roof of the slot, reaching 7.040 at x = 81. Maximum thickness is 13.475 percent at x = 40. Table II gives slot widths from 1.925 at x = 74.0 to 1.750 at x = 83.0, and Table III the fore trailing-edge thickness from 0.910 at x = 78.5 down to 0.050 at x = 83.0.
Selection of Design Conditionsp. 10
The thickness ratio, 0.135, is somewhat greater than on contemporary subsonic aircraft flying near the drag rise. A later drag rise should permit thicker wings, which means higher aspect ratio or lighter structure. The design lift coefficient, about 0.65, is well above typical cruise values, chosen in anticipation that the airfoil would be used on sweptback wings: the section normal to the swept elements feels a dynamic pressure reduced by a function of the square of the cosine of the sweep angle , so it must work at a correspondingly higher lift coefficient (p. 10). In simple sweep theory,
and are the dynamic pressure and lift coefficient of the section normal to the sweep line, the wing lift coefficient. The report states the idea in words and gives no sweep angle.
The authors stress that the shape is not necessarily the optimum, merely the best found so far, and that real aircraft may need substantial changes (p. 10).
Experimentspp. 11–15
Apparatus and Measurementspp. 11–13
Wind tunnel. The Langley 8-foot transonic pressure tunnel has solid side walls, which act as end plates for a model spanning the tunnel, and slotted upper and lower walls that let the flow field develop vertically almost as in free air. The wall slots were opened to about 15 percent of the wall, against the normal 5 percent, to reduce losses from flow through them (p. 11).
Models. Two full-span steel models were rigidly attached to the walls and tested inverted: the 13.5-percent supercritical airfoil and an NACA 64₂A215 reference (Tables I–IV). Both were built with 18-inch chords. After modification the supercritical model's chord was 19.9 inches, and a reference chord of 20.0 inches was used in reducing its data. The aft component hangs from six strut sets that allow its position and incidence to be changed about a pivot at the slot's centre of curvature. Results at α = 0° and 1° are for the tabulated shape; those at −1° and 3° are for a slightly different shape (p. 11).
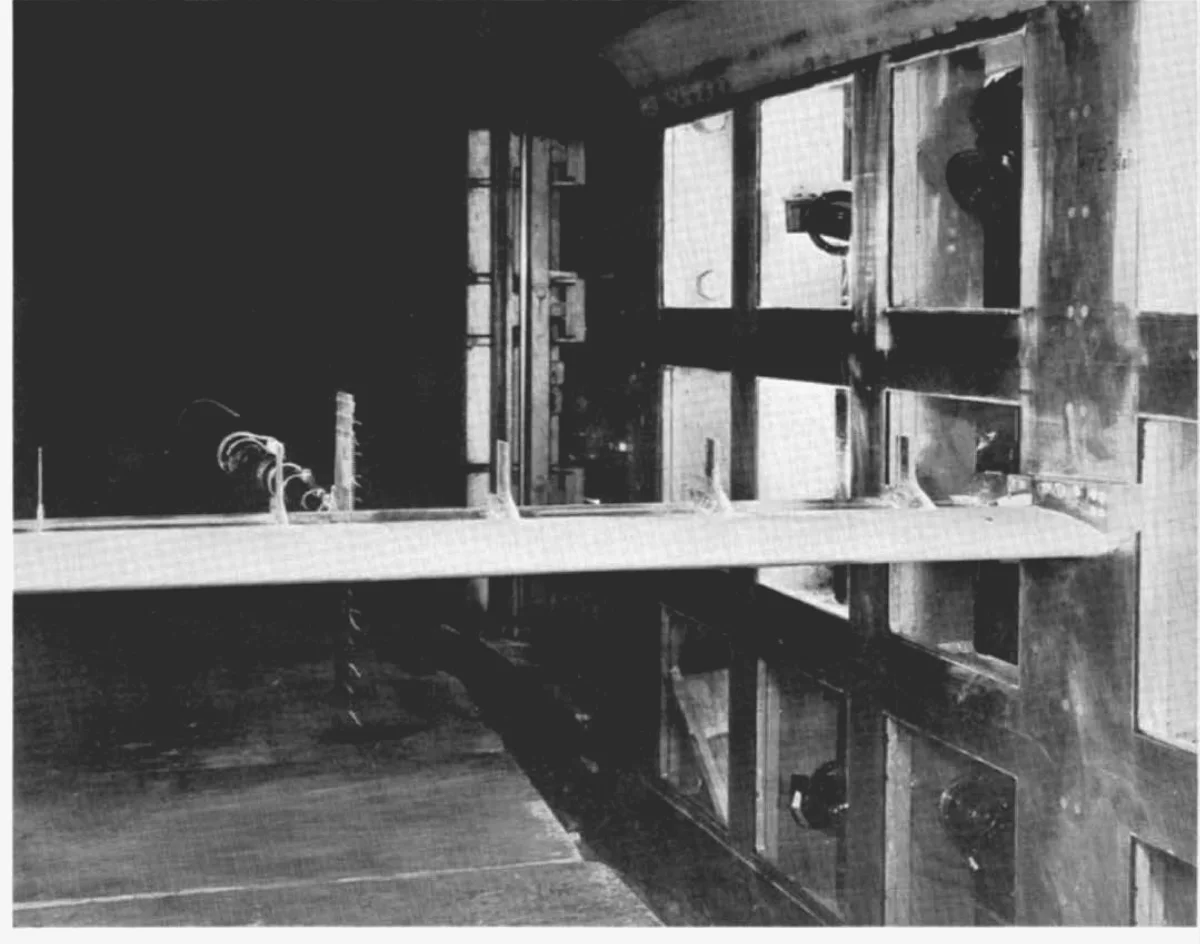
Transition. At 0° and 1°, No. 150 carborundum strips were placed at 8 percent chord on both surfaces of the fore component. Earlier configurations, and the reference airfoil, used other sizes and positions, and their results were adjusted (p. 12).
Measurements. Surface pressures came from two chordwise rows of orifices about 0.01 inch in diameter, at 0.075c and 0.425c from the tunnel centre line, read by scanning valves (Tables V–VI). Drag came from a rake 18 inches behind the trailing edge, with total-pressure tubes about 0.45 percent of chord apart in the viscous wake and up to 10 percent apart where only shock losses were expected; it reached about one chord above the wake and a third below. Schlieren photographs could only cover the rear of the airfoils; a vertical strip of tape on the window marks the slot exit. Fluorescent oil film showed the surface flow (pp. 12–13).
Reduction of Data and Accuracypp. 13–15
Machine summation of orifice pressures gave within 1 percent of hand integration, but differences of up to 7 percent, from too few orifices near the trailing edge, so supercritical at 0° and 1° was hand-integrated and the −1° and 3° values corrected by the same increments. Wake-drag accuracy is estimated as better than 1 percent (pp. 13–14). The reference airfoil's drag was corrected to the supercritical model's transition location; the result checks almost exactly NACA Report 824's value corrected for compressibility and transition strips (p. 14).
Wall corrections. The main wall effect is a strong upflow at the inverted model, so the true angle of attack is below the geometric one. In degrees at mid-chord,
The angles in the report are not corrected for this; because forces come from pressures and the wake, the upflow only shifts the angle at which a given result is obtained. At the design point it varies from 1.46° at the leading edge to 2.03° at the trailing edge, a streamline curvature small compared with the airfoil's own. Blockage is called trivial (pp. 14–15).
Results and Discussionpp. 15–19
Basic Aerodynamic Characteristicsp. 15
Figures 5 and 6 give , α and against at each Mach number for the two airfoils. Figure 7 cross-plots them against Mach number at , 0.65 and 0.80. For the supercritical airfoil these points lie close to actual test conditions just below the abrupt rise: α = −1° at , 0° at 0.79 and 1° at 0.77 for the three values. At 0.65 the curve extends past Fig. 5's data using runs at α = 0°, where was almost exactly 0.65 (p. 15).
Design Normal-Force Conditionpp. 15–18
At the supercritical airfoil shows a very shallow drag rise to , then a dip in drag at 0.79, then an abrupt rise. Drag at 0.79 is only slightly above the essentially subcritical value at 0.65. The abrupt rise comes about 0.12, or 18 percent, later than the drag rise of about 0.67 estimated for a 13.5-percent 64A-series section from the 64₂A215 data (pp. 15–16).
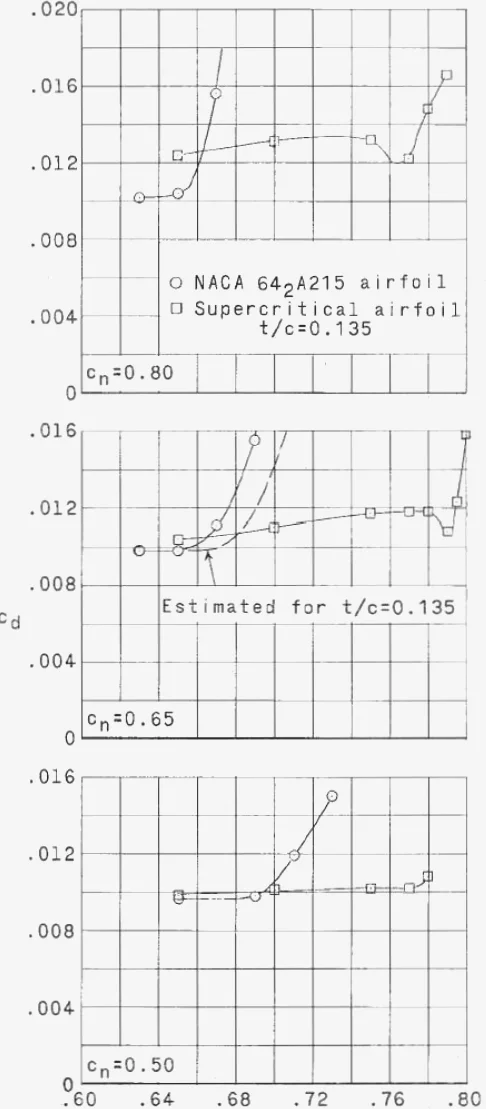
Drag at the optimum Mach number conditionpp. 16–17
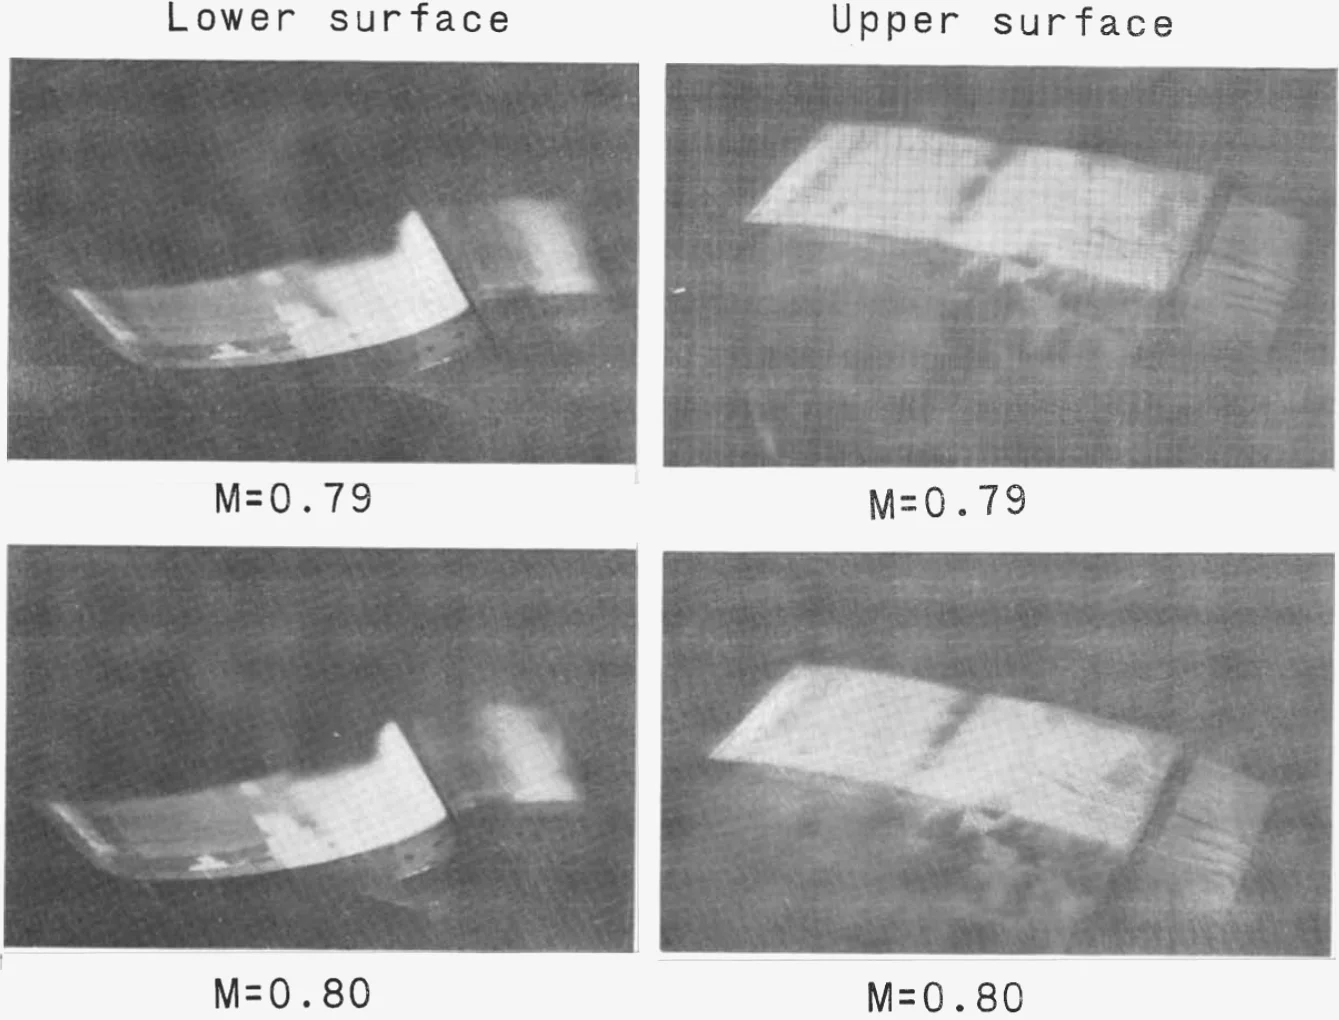
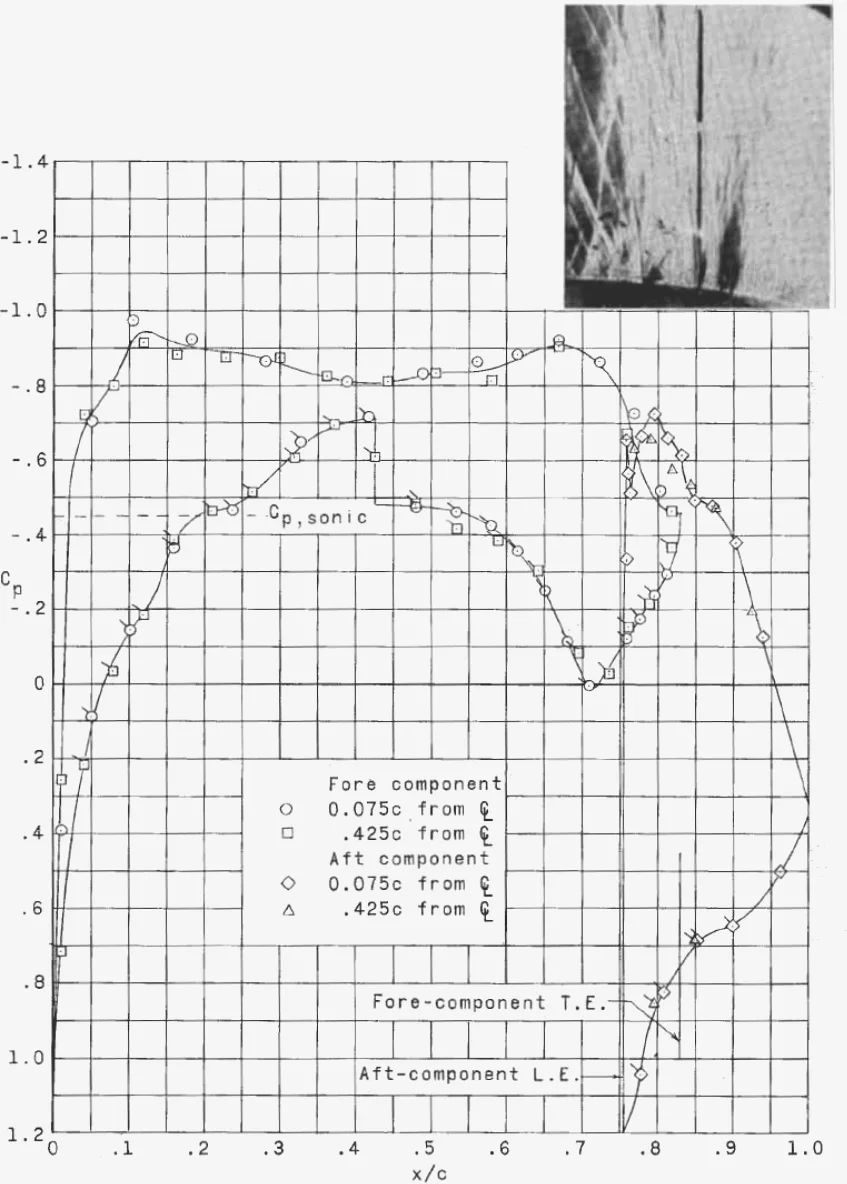
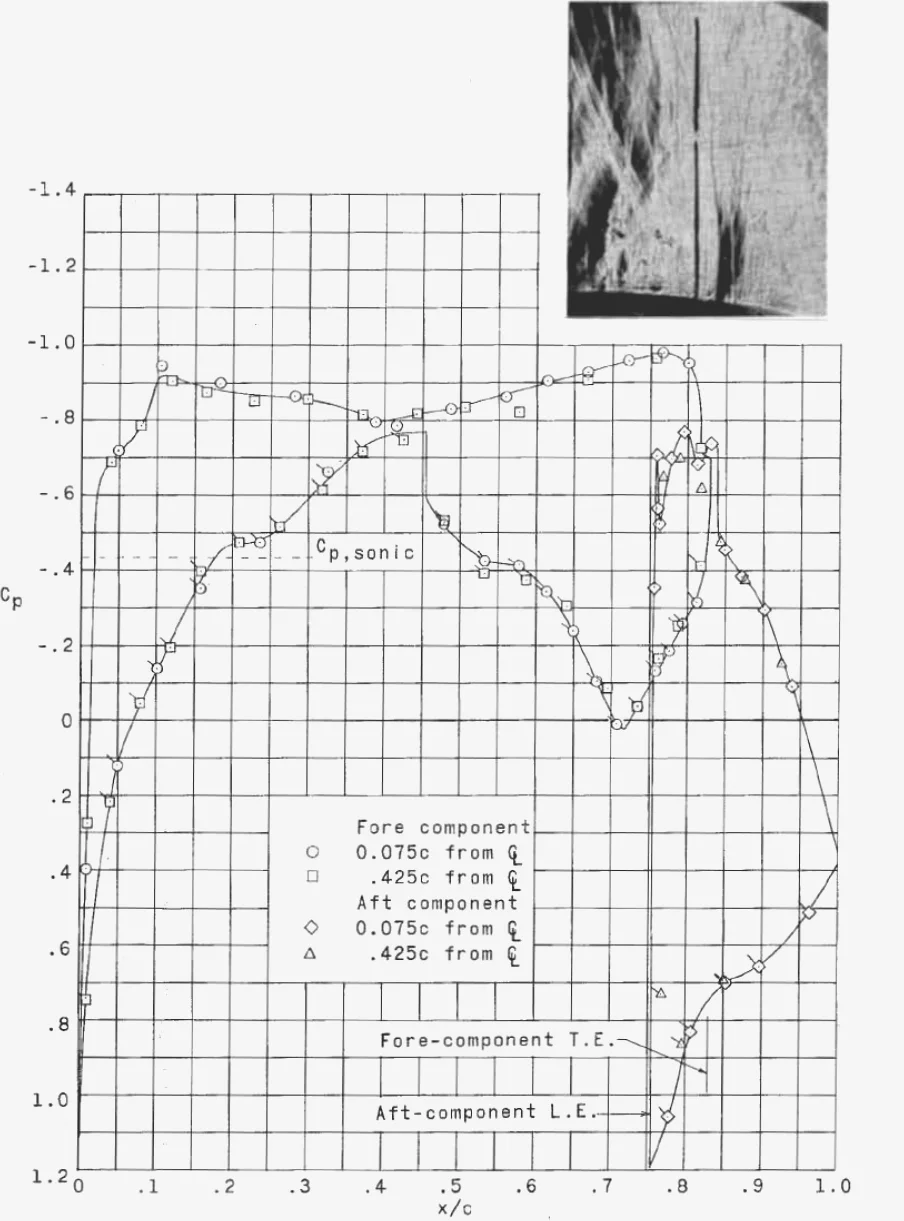
Pressures with schlieren (Fig. 8), oil flow (Fig. 9) and wake profiles (Fig. 10) show that the near elimination of drag rise at comes from two effects: complete absence of separation on both surfaces, and an essentially complete elimination of the shock wave. The flow recompresses shock-free to near-sonic conditions just ahead of the slot (p. 16).
The elimination of shock losses was unexpected.Results and Discussion, p. 16
The authors' explanation: the surface Mach number just behind the recompression region is slightly supersonic, so compression waves from the trailing-edge recovery cannot run forward along the surface and pile into a shock. About 0.3 chord above the surface, the schlieren shows subsonic flow, so the waves travel forward there and then down into the supersonic region, decelerating it essentially shock free. Tests of similar shapes showed that the key ingredient is slightly supersonic flow just ahead of the slot; when that region is subsonic, an ordinary shock forms (pp. 16–17).
Over the aft component's upper surface the flow peaks at about Mach 1.1, a pressure coefficient of about −0.68, again with no visible shock. Drag at the optimum is about 10 percent above the 64₂A215's below its drag rise, mostly skin friction from the slot's added wetted area and the lower Reynolds number of the aft component's short boundary layer (p. 17).
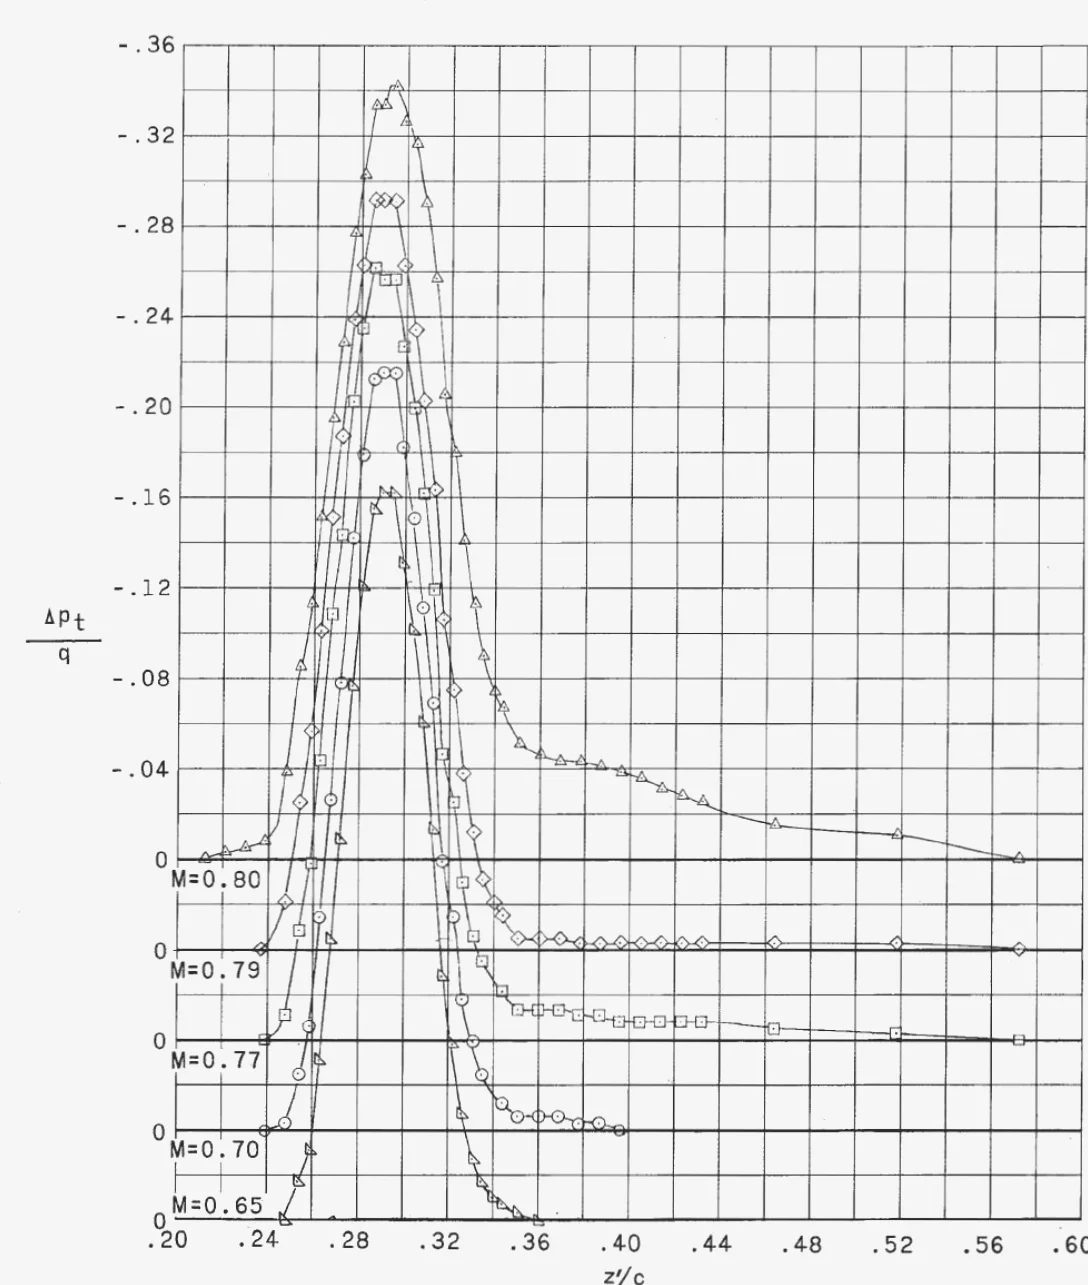
Drag below and above the optimum Mach numberpp. 17–18
Below the optimum, oil flow shows no separation on either surface. The gradual drag rise to about 0.78 is wave loss from a weak shock over the middle of the fore component's upper surface (p. 17).
Above 0.79 the abrupt rise comes from larger wave losses plus separation on the aft component's upper surface, caused by a shock just behind the slot exit (Fig. 8(g)). There is no significant separation on the fore component's lower surface up to 0.80, despite a much stronger lower-surface shock. Earlier configurations showed that beyond 0.80 that lower boundary layer finally separates, with a large loss of normal force; delaying it is the key to any further gains, perhaps with a saddle-back lower-surface pressure distribution like the upper surface's (pp. 17–18).
Pitching moment at optimum Mach numberp. 18
At , , against about −0.05 for the 64₂A215 below its drag rise. The difference comes from the heavy load on the aft component, which carries 0.4 of the total normal force at this Mach number. The authors call this large moment inherent in the design (p. 18).
Off-Design Normal-Force Conditionspp. 18–19
Above design () the same drag dip appears, at about , again with an apparently shock-free recovery somewhat further forward and slightly supersonic flow behind it (Fig. 11). The extra normal force from more angle of attack is centred near the quarter chord up to (p. 18).
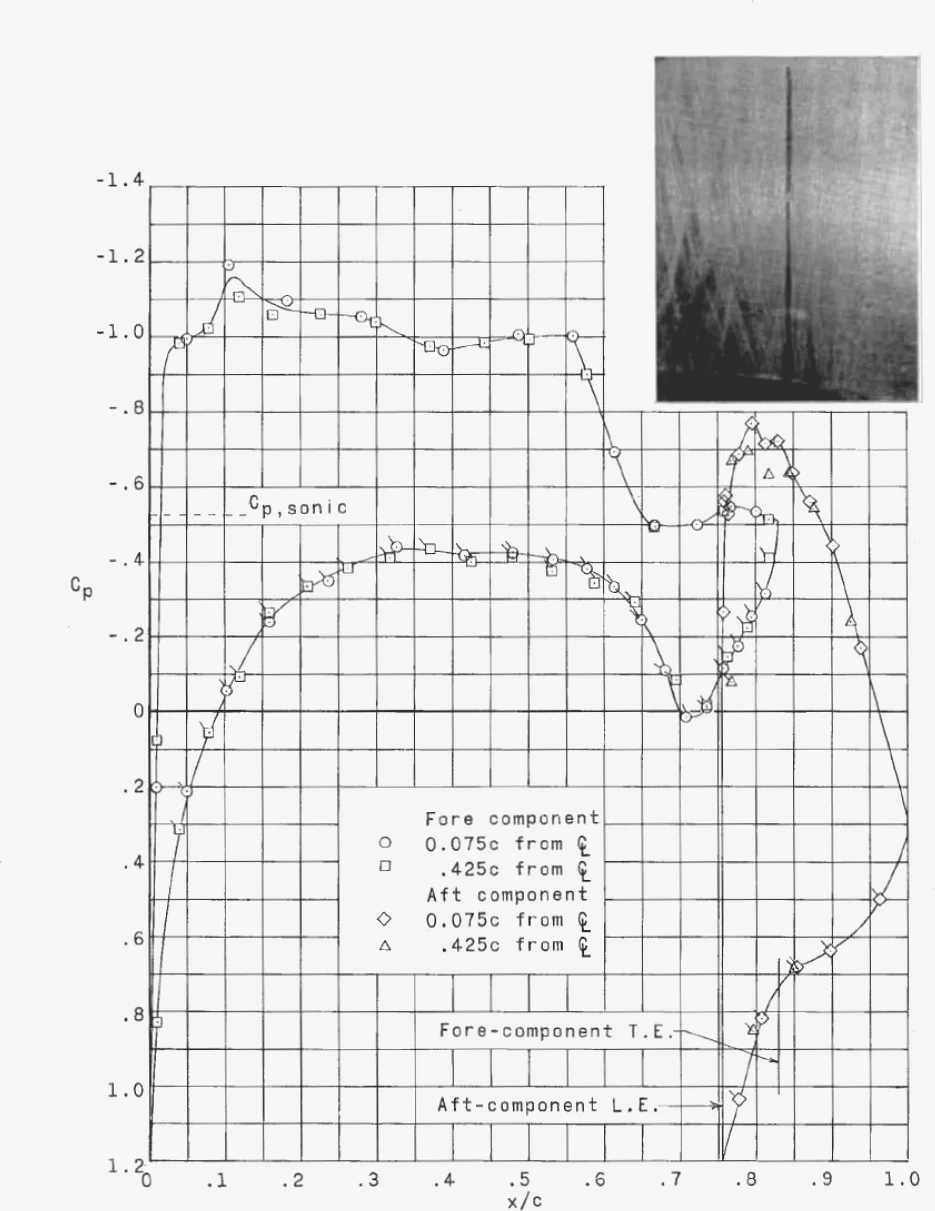
High normal force. At α = 3°, was 1.24, 1.02 and 1.14 at , 0.70 and 0.75. Despite a very strong shock (Fig. 12), oil flow showed no significant upper-surface separation; the extra drag is mostly magnified shock loss. The dip at 0.70 comes from a marked forward shock movement that the authors say is not understood. The 64₂A215, by contrast, loses lift-curve slope above at –0.67 and at much lower at higher speeds, so the new shape, particularly the slot, greatly improves high-speed stall (pp. 18–19).
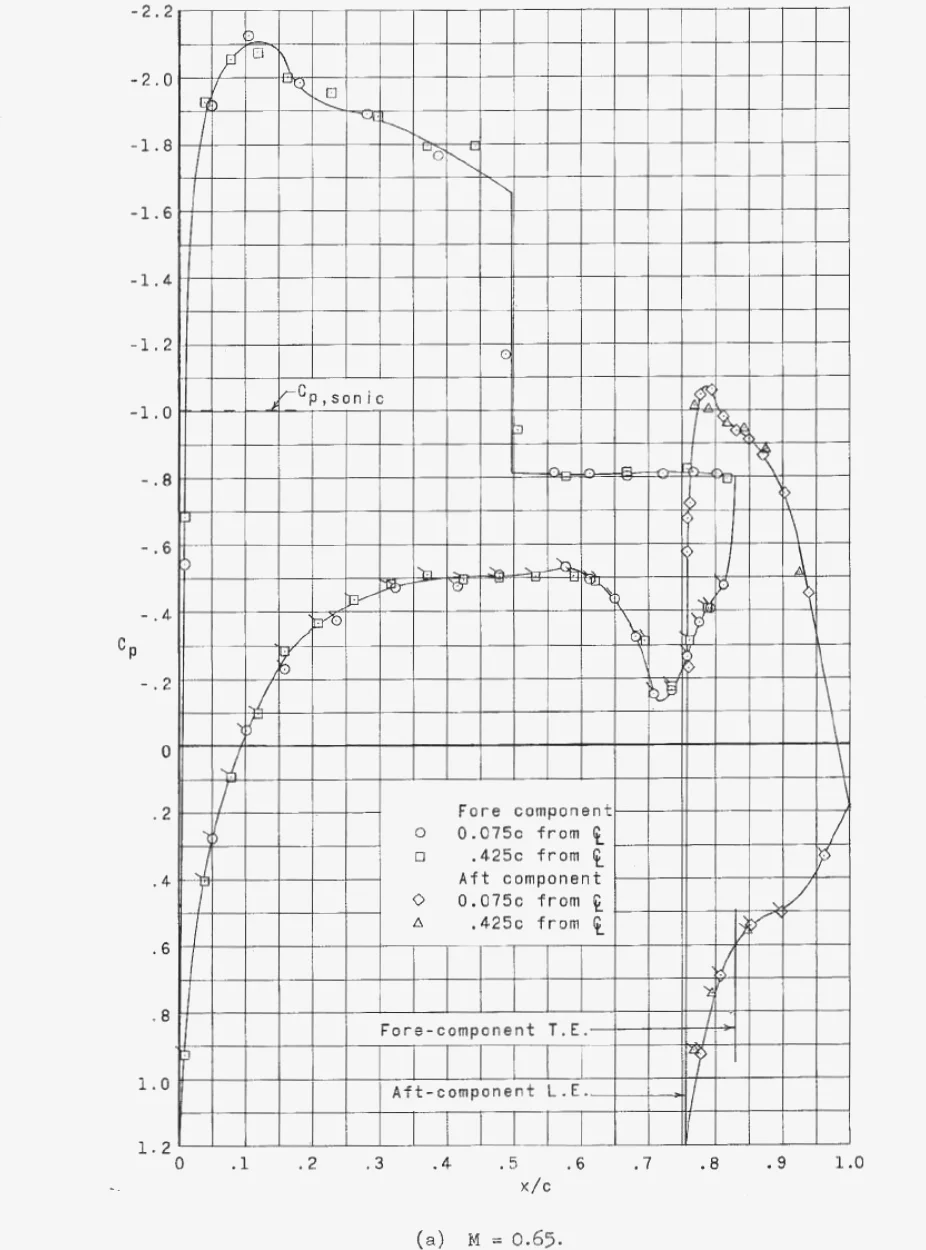
Below design (), drag rises at , in roughly equal parts from shock-induced separation on the lower surface and shock losses above, caused by supersonic regions on the fore component's lower surface and the rear of the upper surface. The airfoil's operation is critical below its design . Reducing the aft component's relative angle, and making up the lift with angle of attack, might help, but would need variable aft-component incidence in cruise (p. 19).
Conclusionspp. 19–20
- At the design of 0.65, the supercritical airfoil's abrupt drag rise occurs just above , against 0.67 for the 64A-series section of equal thickness. Just below it, drag is almost entirely skin friction and about 10 percent above the 64A-series value.
- Its section pitching moment is substantially more negative than that of conventional sections.
- It also delays drag rise at off-design lift coefficients.
- It substantially increases the stall normal-force coefficient at high subsonic Mach numbers.
- Its operation appears most critical at normal-force coefficients below the design value.
The report is dated 20 April 1965 and was published in July 1965 (pp. 1, 20).
Assumptions and open questions
Key assumptions
- Two-dimensional models spanning a slotted-wall tunnel, with the wall slots opened to about 15 percent, represent the free-air section. Angles are given uncorrected for the wall upflow of about degrees, and blockage is taken as negligible (pp. 11, 14–15).
- Boundary-layer transition is fixed by carborundum strips at 8 percent chord. Results for other transition arrangements are brought to this condition by drag increments measured at 0° and 1° (pp. 12, 14).
- Results at −1° and 3° come from a slightly different shape and are adjusted by the drag differences found at 0° and 1°; normal force and moment are taken as essentially unaffected (p. 14).
- The 64A-series baseline at 13.5 percent thickness is estimated from measurements on the 15-percent 64₂A215 (pp. 15–16, Fig. 7(a)).
- The design lift coefficient of about 0.65 assumes use on a swept wing, whose sections normal to the sweep see a dynamic pressure reduced by the square of the cosine of the sweep angle (p. 10).
- The slot flow is choked at the exit, with entrance and exit widths nearly equal; earlier tests found area variations of 4 to 8 percent and moderate width changes had little effect (p. 9).
Where further work would help
- Reynolds number and scale. The report does not give the test Reynolds number, and it attributes part of the 10 percent drag increment to the short aft component's low Reynolds number (p. 17). Tests at larger scale or higher pressure would show how the skin-friction penalty, the slot flow and the shock-free recompression change toward flight conditions.
- The shock-free recompression. The authors describe it as unexpected and not yet fully understood, and their schlieren view covered only the rear of the airfoil (pp. 13, 16). Flow-field surveys over the whole supersonic region, and small steps in Mach number and lift around the design point, would show how wide and repeatable the shock-free condition is.
- Below the design lift. At the drag rise comes from lower-surface separation and shock losses, and the authors suggest reducing the aft component's incidence (p. 19). Systematic variation of aft-component incidence and of the lower-surface shape, including their proposed saddle-back pressure distribution (pp. 17–18), would map this sensitivity.
- Beyond Mach 0.80 and 3° angle of attack. Earlier configurations lost normal force when the fore component's lower boundary layer separated above 0.80 (p. 17); results here stop at 0.80 and α = 3°.
- Other thicknesses and lifts. Only one 13.5-percent shape is reported in detail, at a design of 0.65 (pp. 2, 10). A family of thicknesses and design lifts would show how far the 0.12 gain in drag-rise Mach number carries over.
- Three-dimensional wings. The design lift is chosen with swept wings in mind (p. 10), but all tests are two-dimensional. Swept-wing tests would show how spanwise flow, the slot and the large nose-down moment (, p. 18) behave on a real wing, together with the practical questions of slot tolerances and a fore-component trailing edge about 0.0005c thick (Table III).
What happened next
- 1964
Reviewing Ling-Temco-Vought tunnel data for a VTOL concept that blew air from a slot in the wing, Whitcomb notices the slot flow raises the drag-divergence Mach number. His group starts slotted-airfoil tests in the Langley 8-Foot Transonic Pressure Tunnel, with Charles D. Harris as lead researcher (SP-4529, p. 8).
- 1966
Worries about building and maintaining the slot lead to the unslotted integral supercritical airfoil, first tested this year, with only a small drag-rise penalty. A thickened trailing edge follows in 1968 (SP-4529, p. 9).
- 1970
A Navy T-2C Buckeye flies with a 17-percent-thick supercritical wing; at its cruise Mach number of about 0.60 it matches a conventional 12-percent wing (SP-4529, p. 10).
- 1971
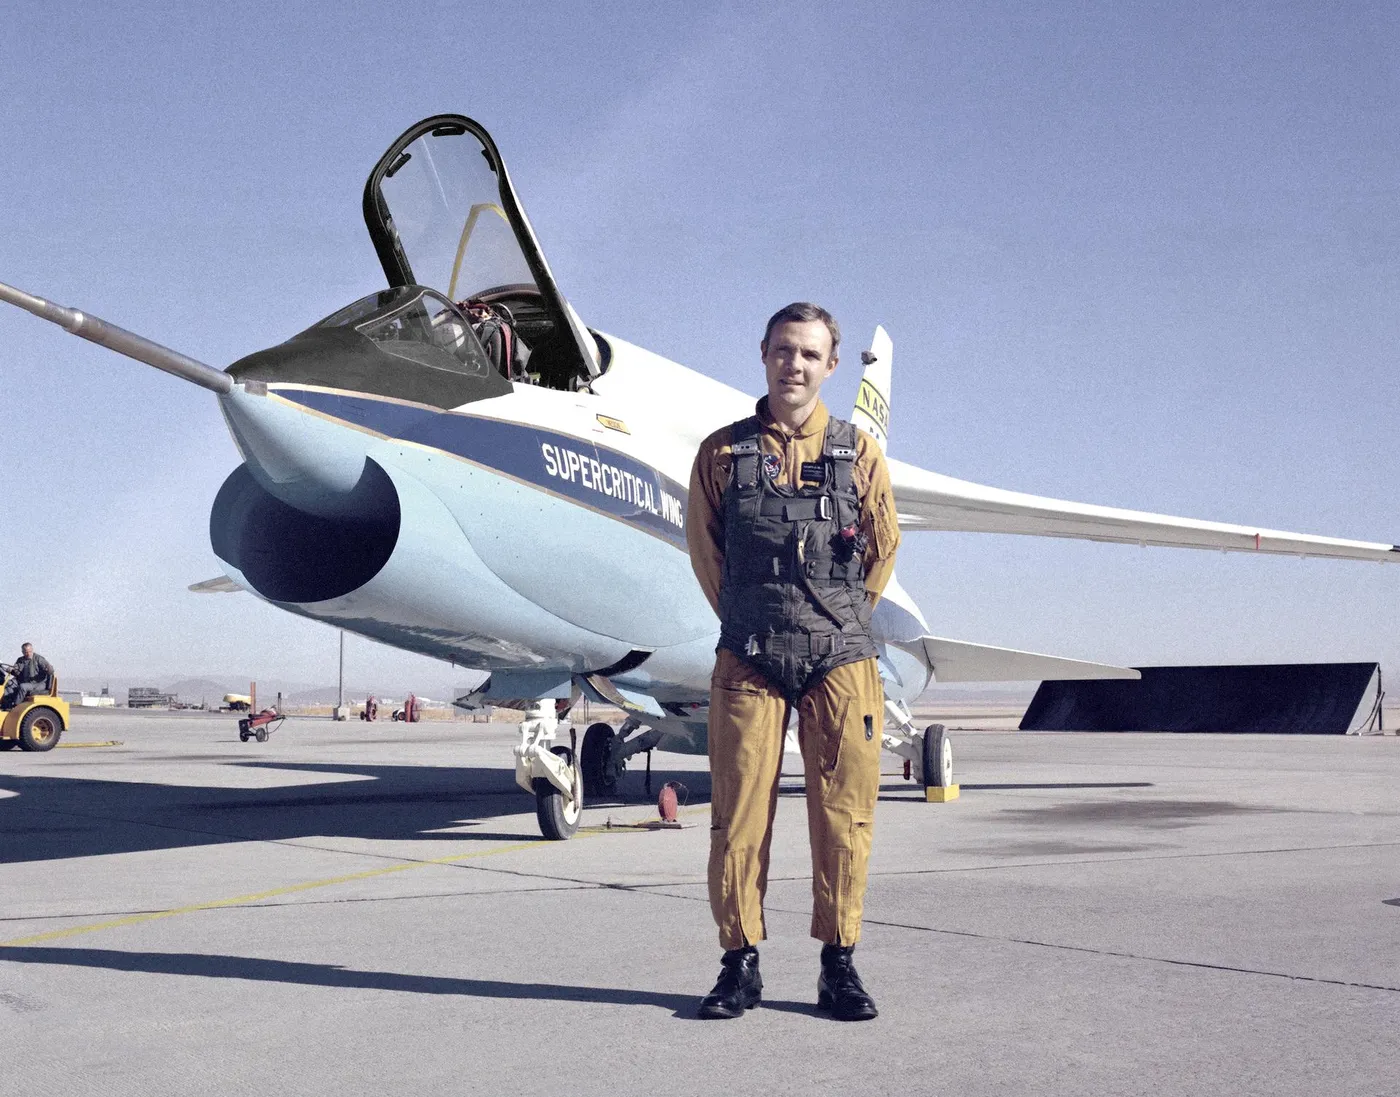
9 March: Tom McMurtry makes the first flight of NASA's F-8 Supercritical Wing at the Flight Research Center, Edwards. The 86-flight program ends on 23 May 1973 (SP-4529, p. 11; NASA fact sheet FS-2002-09-044).
- 1973
The F-8 results show transonic efficiency improved by as much as 15 percent and a drag-rise Mach number of 0.96 at cruise lift; the F-111 TACT supercritical wing first flies (SP-4529, pp. 13–14).
- 1974
NASA awards Whitcomb its maximum $25,000 prize for the invention. Supercritical wings later become common on subsonic transports, used mostly for thicker, less swept wings rather than higher speed (SP-4529, p. 14; FS-2002-09-044).
Sources
- Whitcomb & Clark, An Airfoil Shape for Efficient Flight at Supercritical Mach Numbers, NASA TM X-1109 (1965) · Public use permitted. The scan lacks printed pp. 40–45 and Fig. 14.
- J. R. Chambers, Concept to Reality: Contributions of the NASA Langley Research Center to U.S. Civil Aircraft of the 1990s (NASA SP-2003-4529) · Supercritical Wing Technology, pp. 7–14
- NASA Dryden fact sheet FS-2002-09-044: F-8 Supercritical Wing
- R. T. Whitcomb, Review of NASA Supercritical Airfoils, ICAS Paper 74-10 (1974) · Citation only
- NASA Image Library: F-8 SCW on ramp with test pilot Tom McMurtry (ECN-3442)