
At a glance
- Category
- A review memorandum, written up from a January 1967 conference talk (p. 1). It compares solid-, liquid- and gas-core nuclear rockets on performance potential and technology status. Most of it is synthesis, but it also reports Lewis's own work: the water-moderated tungsten reactor, the full-size cavity criticality experiment in Idaho, and coaxial-flow mixing theory checked against tests.
- Context
- By 1968 the joint NASA–AEC Rover program had run since 1958, building on Los Alamos work begun in 1955. It had tested Kiwi, NRX and Phoebus reactors and the NRX-EST breadboard engine, and had just dropped the 200,000-lb NERVA II for a 75,000-lb, 1500-MW NERVA (pp. 10–11). The liquid-core analysis draws on Ragsdale and colleagues (NASA TN D-4148, D-4127, D-4413).
- Contributions
- A side-by-side comparison of solid, liquid and gas cores in specific impulse, thrust, thrust-to-weight and uranium loss (Summary of Results, pp. 36–37).
- A materials case for solid cores: melting points (Table I) and vaporization rates (Fig. 5), leading to two fuel-element families, tungsten–UO₂ and coated graphite–UC.
- Liquid-core estimates showing why the uranium carried away in the exhaust, about 1 lb per 50 lb of hydrogen, is the real limit (Figs. 15–17).
- Lewis's cavity critical experiment, which found critical masses three to four times the earlier calculations, and the resulting pressure ladder for an operating gas core of about 1000 atmospheres (Fig. 20, Table III).
- Coaxial-flow fluid mechanics and seeded-hydrogen heat transfer, showing that wall heat flux can be kept below 1 kW/in² (Figs. 21–25).
Summaryp. 1
The report compares the three basic types of nuclear powerplant, solid, liquid, and gas core, on performance potential and the status of current technology (p. 1). Its findings in one line each:
- Solid core: specific impulse around 850 s, any thrust above about 10,000 lb, thrust-to-engine-weight of 2 to 20, and negligible fuel loss. A breadboard engine has already exceeded 700 s at about 50,000 lb of thrust.
- Liquid core: 1200 to 1500 s, thrust-to-weight of 1 to 10, but 0.01 to 0.1 lb of uranium lost per lb of hydrogen.
- Gas core: 1500 to 2500 s, thrust above 100,000 lb because the engine itself will not weigh less than that, thrust-to-weight of 1 to 20, and the same high uranium loss.
Introductionpp. 1–3
The nuclear-rocket engine appears to be a major contender for the propulsion system of manned interplanetary space vehicles.Introduction, p. 1
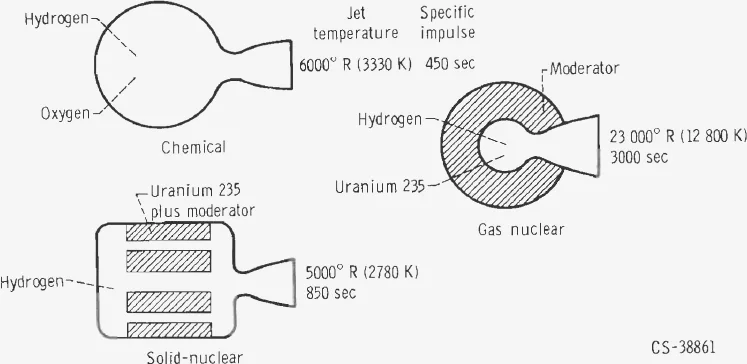
Every rocket aims for the highest specific impulse (thrust per unit propellant weight flow, in seconds), because that minimises the propellant a mission needs. The rule is to heat the lowest-molecular-weight propellant to the highest possible temperature. A hydrogen–oxygen engine burns at about 6000 °R (3330 K) with exhaust of molecular weight about 8, which caps it at about 450 s. The limit is the chemical energy of the propellants (p. 1).
Fission sidesteps that limit by heating hydrogen without increasing its molecular weight (p. 1). The report states the principle in words. In equation form, ideal nozzle flow gives an exhaust velocity that scales as the square root of temperature over molecular weight:
exhaust velocity, m/s², chamber temperature, molecular weight of the exhaust. The scaling is anchored on the report's own chemical point and assumes the nozzle and gas properties stay otherwise similar.
- Solid core: fuel held in solid heat-transfer surfaces can heat hydrogen to about 5000 °R (2780 K), giving about 850 s (pp. 1–3).
- Liquid core: hydrogen heated by a fissioning liquid, limited by the liquid's boiling point or vaporization rate (p. 3).
- Gas core: uranium-235 fissions as a gas in a cavity much like a combustion chamber, at about 100,000 °R (55,600 K). It heats a hydrogen jet to about 23,000 °R (12,800 K) for up to 3000 s (p. 3).
- M = 8 (H₂–O₂ products)
- M = 2 (molecular H₂)
- M = 1 (atomic H)
- points printed in the report
- selected temperature and M
- Specific impulse
- 818s
- Exhaust speed
- 8.0km/s
- Jet power per 1000 lbf thrust
- 17.8MW
Solid-Core Nuclear Rocketspp. 3–15
Hydrogen from a liquid-hydrogen turbopump cools the nozzle, the reflector and any other parts that need it, and is heated as it flows through the reactor core before leaving through the nozzle. Control rods or drums regulate the reactor (p. 4).
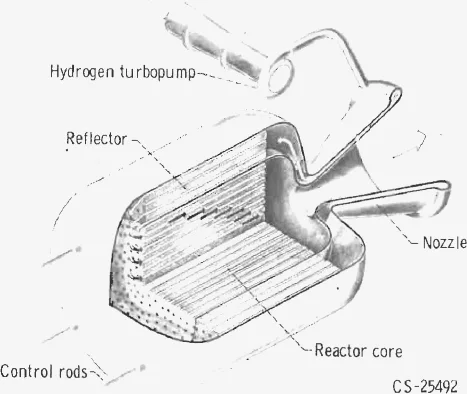
Types of Solid-Core Nuclear Rocketspp. 4–5
- Homogeneous: fuel and moderator mixed intimately, so the moderator must also survive high temperature. That dual requirement narrows the choice of materials.
- Heterogeneous: fuel elements sit apart from the moderator. The fuel can use the best high-temperature materials and the moderator the best moderating ones, cooled separately to any temperature.
- Fast: no moderator at all. This removes the dual requirement, but needs more fissionable material, which adversely affects the high-temperature properties of the core (pp. 4–5).
Fuel Elements for Solid Core Reactorspp. 5–10
Fuel can be shaped as plates, concentric rings, tubes, hole matrices or honeycombs (Fig. 4, p. 5). The report lists six requirements: operation near 5500 °R (3060 K) with low evaporation and adequate strength, compatibility with the fissionable material, compatibility with hydrogen, recyclability through starts and stops, low neutron absorption, and fabricability. Temperature matters most (pp. 5–6).
| Type | Material | °R | K |
|---|---|---|---|
| Fuels | Uranium nitride¹ | 5690 | 3160 |
| Uranium dioxide | 5535 | 3073 | |
| Uranium carbide | 4810 | 2670 | |
| Uranium | 2530 | 1408 | |
| Metallic refractories | Tungsten | 6580 | 3655 |
| Rhenium | 6200 | 3445 | |
| Tantalum | 5890 | 3273 | |
| Molybdenum | 5170 | 2872 | |
| Nonmetallic refractories | Hafnium carbide | 7490 | 4161 |
| Tantalum carbide | 7480 | 4157 | |
| Carbon² | 7190 | 3995 | |
| Niobium carbide | 6790 | 3495 | |
| Zirconium carbide | 6210 | 3450 |
¹ Decomposes. ² Sublimes.
Uranium metal melts at only 2530 °R. UN decomposes without a nitrogen atmosphere. UO₂ melts highest of the practical fuels, but evaporates fastest: two orders of magnitude faster than UC (Fig. 5, p. 8). At 5500 °R carbon vaporizes about a thousand times faster than tungsten, and niobium carbide about ten times faster. Carbon is attractive because it is both a moderator and a refractory, but it reacts very strongly with hydrogen and must be coated (pp. 7–8).
The logic leads to two fuel elements: UO₂ particles in tungsten, clad in pure tungsten, or graphite containing UC, with NbC coating the surfaces that touch hydrogen. These are built as cermets, solid solutions or bulk fuel pins (Fig. 6, p. 9).
Current Graphite Reactor Programpp. 10–12
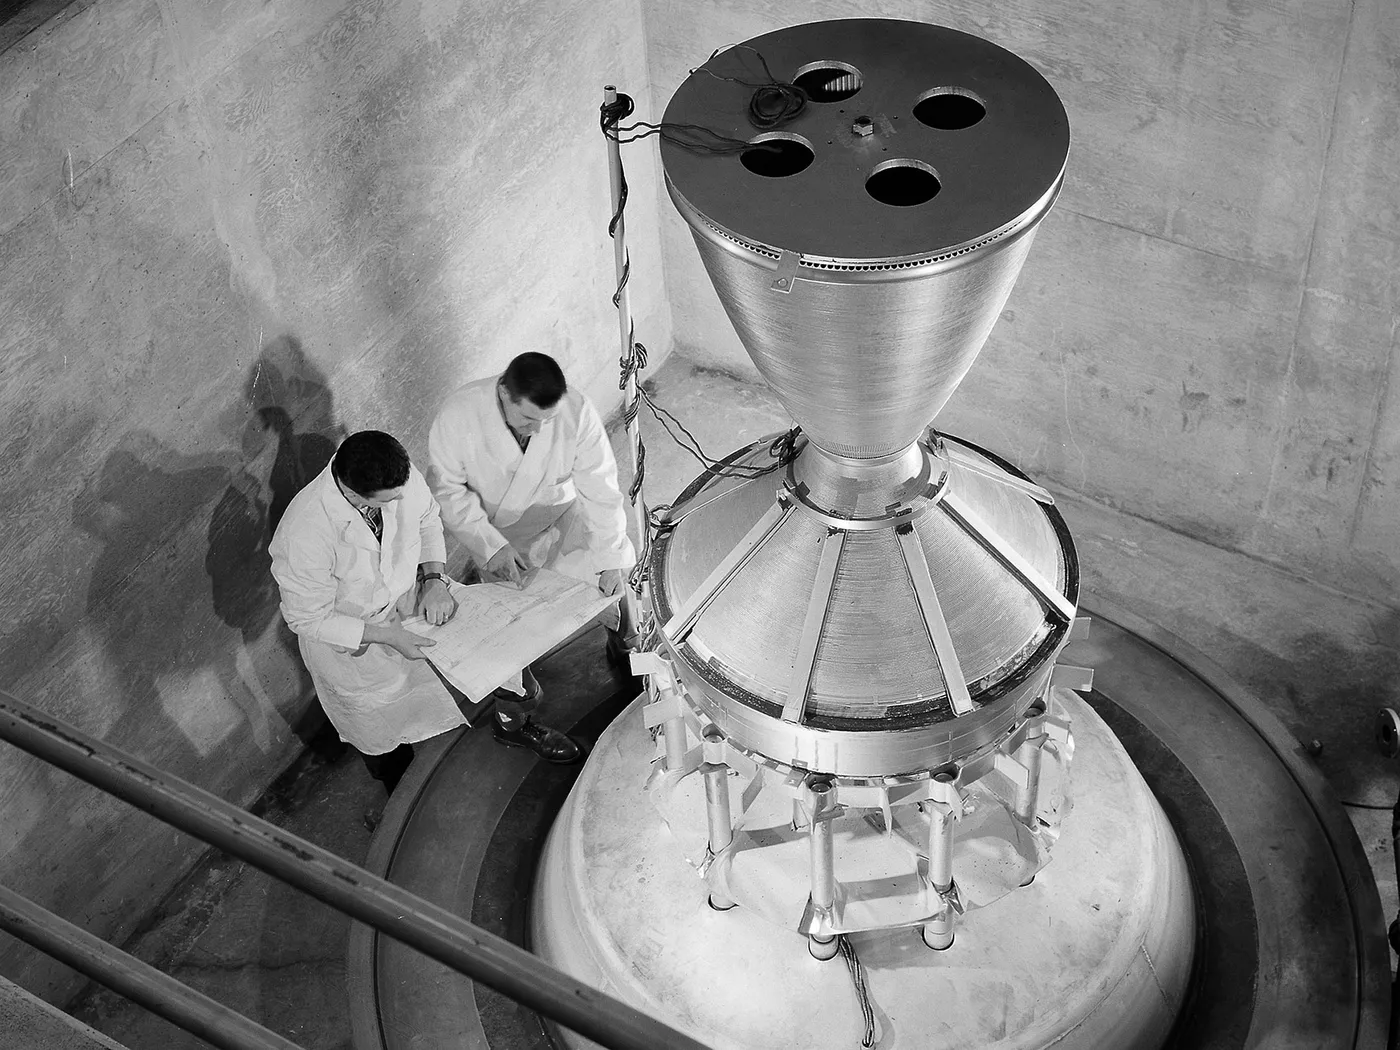
Rover began at Los Alamos in 1955 and became a joint NASA–AEC effort in 1958. Kiwi-A, designed for 100 MW thermal, ran in 1959, and the Kiwi-B series followed at 1100 MW. In November 1962 Kiwi-B4A suffered fuel damage from pressure- and flow-induced vibration. After laboratory flow tests in 1963 found the cause, power testing resumed in May 1964. Since then seven Kiwi and NERVA reactors and one breadboard engine had been tested, all with graphite elements of pyrolytic-carbon-coated UC particles and NbC-coated flow passages. Several were restarted, and total full-power time was about two hours (p. 10).
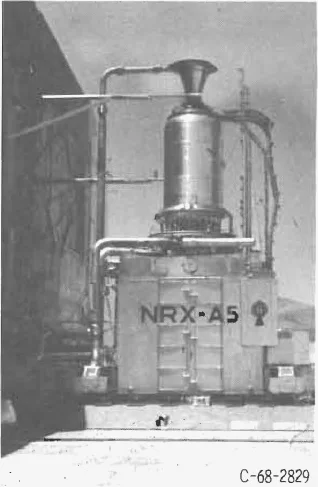
The key test series was NRX-EST, the breadboard engine. It started and shut down ten times and ran 28 minutes at full power over four of those runs. It reached 4170 °R (2320 K) exhaust and showed bootstrapping: the engine started on reactor heat and tank pressure alone, with no external pump power, going from about 1 MW to full power in under a minute (p. 11). Footnotes added in 1968 report NRX-A6 running 60 minutes at full power and Phoebus 2A running 12 minutes above 4000 MW (p. 11).
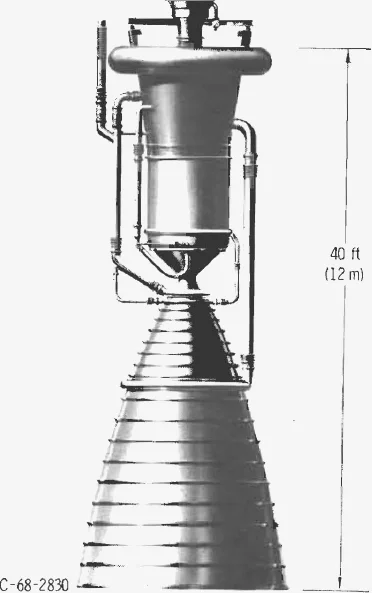
The engines quoted all imply the same ratio of reactor power to thrust. The kinetic power in the jet is , so
thrust, fraction of reactor power that ends up as jet kinetic power. At 825 s, is 18 MW per 1000 lbf.
| Engine | Thrust, lb | Power, MW | MW per 1000 lb | Jet power at the stated Isp |
|---|---|---|---|---|
| NERVA II (p. 11, Fig. 8) | 200,000–250,000 | 4000–5000 | 20 | 3600–4500 MW (825 s): 90 % |
| NERVA, 1968 plan (p. 11) | 75,000 | 1500 | 20 | 1350 MW if 825 s: 90 % |
| Water-moderated tungsten (p. 13) | 15,000 | 300 | 20 | 278 MW if 850 s: 93 % |
The report states no Isp for the last two; the values used are its NERVA II and solid-core figures.
Tungsten Reactorspp. 12–13
Argonne studied a fast tungsten–UO₂ reactor and Lewis a water-moderated one. Graphite won at the start only because there was much more experience with it. Tungsten–UO₂ promised longer life and better recyclability and restart capability, but not much higher temperature, assuming graphite's coating problems could be solved (pp. 12–13).
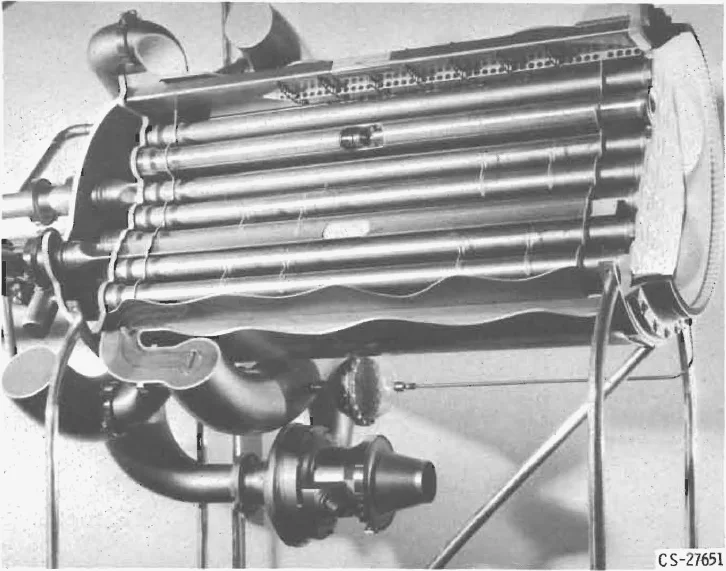
Lewis's design used water-cooled aluminium tubes running through a water tank, each housing a tungsten fuel element insulated by a thin gap of stagnant hydrogen. The water was cooled in heat exchangers by the cold incoming hydrogen. Water is one of the best neutron moderators, which keeps the reactor small: this one was designed for 300 MW and 15,000 lb of thrust (p. 13).
Solid-Core Nuclear-Rocket Performancepp. 14–15
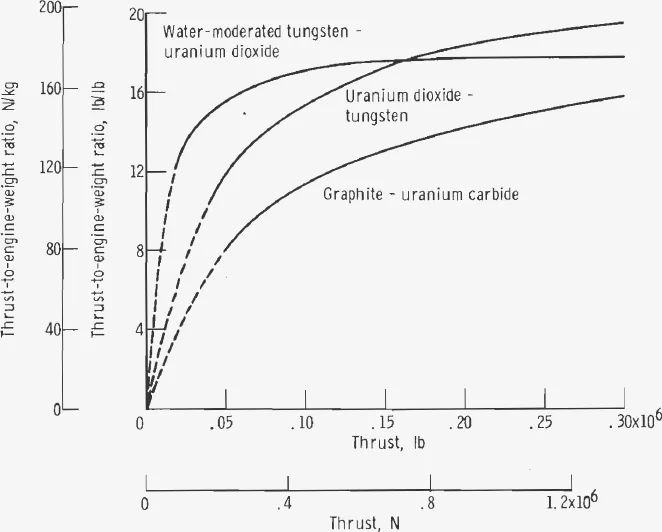
Calculated thrust-to-engine-weight rises steeply with size. At 50,000 lb the graphite reactor would weigh about twice as much as the water-moderated tungsten one. Above 200,000 lb, fuel elements rather than moderator set the weight, and all three types reach 14 to 20 lb of thrust per lb. These are best-case calculations: the report expects the first powerplants built to fall lower. It also notes that all work on tungsten reactors had stopped, so that at least one reactor could be developed within the available funding (pp. 14–15).
Liquid-Core Nuclear Rocketspp. 15–22
Liquid cores are the next step in temperature beyond solid ones. Three types had been proposed (p. 15).
Bubble-Through, Radiation, and Particle or Droplet Liquid Corespp. 15–17
- Bubble-through (Fig. 11): the core spins fast enough to hold a layer of liquid fuel against its wall, and hydrogen bubbles through it, leaving at the liquid's temperature. But the gas leaves saturated with fuel vapour, and the dense liquid tends to drain back through the gas passages. Bearings, balance and fuel makeup are expected to be formidable problems (pp. 15–16).
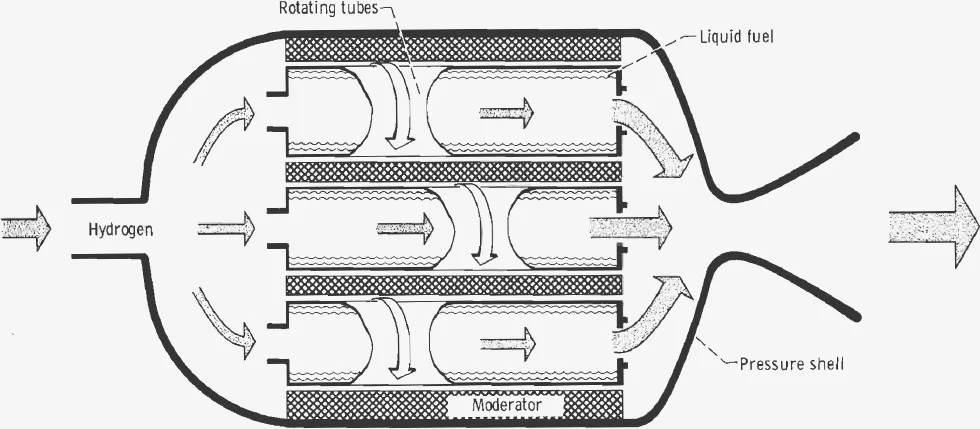
- Radiation (Fig. 12): hydrogen flows down the axis of rotating tubes and is heated by radiation from fuel held on the walls. It must be seeded with absorbing particles, and the liquid must run hotter than the exhaust it produces (p. 16).
- Particle or droplet (Fig. 13): fast hydrogen carries fuel particles or droplets up through the core, and they fall back along the walls to be picked up again. The gas leaves through an annular plug nozzle. This avoids holding a hot liquid against a wall, but the gas is again near saturation (p. 17).
Vaporization Problempp. 18–21
Fuel vapour in the exhaust hurts twice: it raises the molecular weight, and it wastes uranium. UC has the lowest vapour pressure of the fuels, but it is still about a hundred times that of NbC (Fig. 14). Diluting UC to 1 percent in NbC would cut uranium loss about a hundredfold, a several thousand degree Rankine gain in temperature at the same loss rate (p. 18).
The calculations assume 200 atm, a UC:NbC mass ratio of 0.02, and radiation tubes 2 in. across and 60 in. long. The radiation system puts uranium mass fractions of about 0.02 in the exhaust at 9000 °R (1 part in 50), rising to about 0.07 at 10,000 °R (1 part in 14). The bubble-through system, being saturated, is much worse (Fig. 15, pp. 18–20).
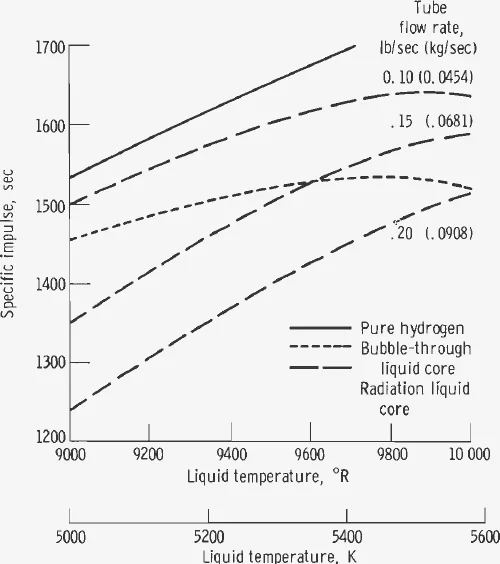
To keep its uranium loss acceptable, a bubble-through core would run nearer 8500 °R and about 1400 s. That matches a radiation core at 9000 °R and 0.15 lb/s per tube. For the same uranium loss, the radiation core is 100 to 200 s better (p. 21).
Thrust-to-Core-Weight Ratiospp. 21–22
Under the same conditions, approximate calculations give thrust-to-core-weight ratios of 2 to 8 for both the radiation and bubble-through cores, greater than 1 in every case (Fig. 17, pp. 21–22).
Liquid-Core Performancepp. 21–22
Liquid cores could reach 1300 to 1500 s with thrust-to-weight of 2 to 10. But a typical uranium mass fraction of 0.02 means 1 lb of uranium leaves for every 50 lb of hydrogen. Cutting that means dropping to 1000–1100 s, so the loss rate of uranium appears to be excessive (pp. 21–22).
Gas-Core Nuclear Rocketspp. 22–34
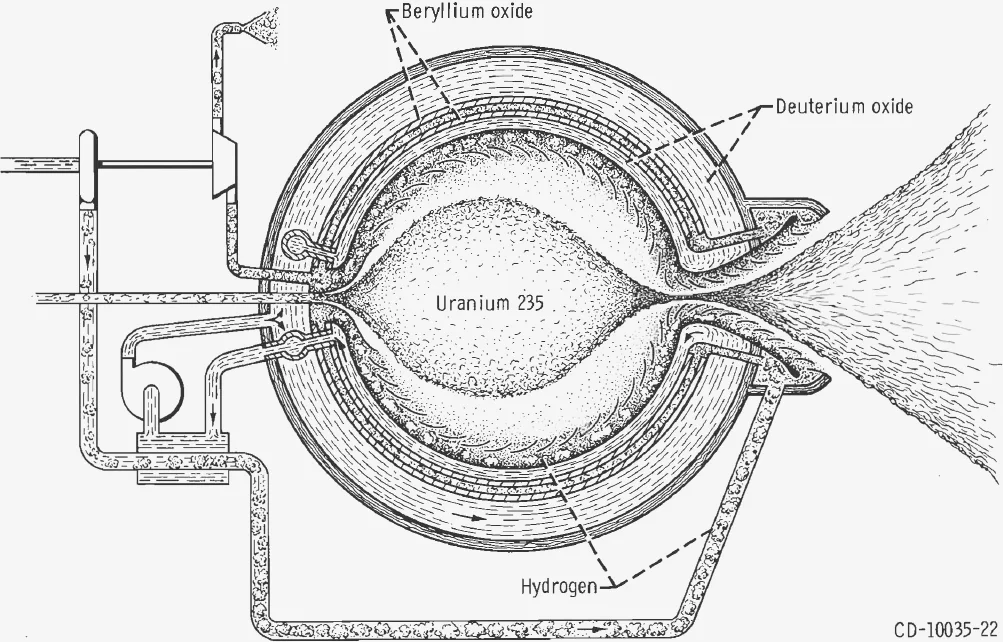
In the coaxial-flow concept, uranium flows slowly into a cavity, vaporizes, and fissions as a gas. Its energy is radiated to hydrogen flowing around it, which enters through porous or slotted walls, seeded so that it absorbs the radiation. The cavity is reflector-moderated by heavy water (D₂O) and beryllium oxide, both cooled by the incoming hydrogen, and bled hydrogen drives the turbopump (pp. 22–23).
Gas-Core Problem Areaspp. 23–24
| Area | Importance |
|---|---|
| Neutronics | Criticality and pressure |
| Fluid mechanics | Fuel loss rate |
| Heat transfer | Temperature, heat loads, and pressure |
Because the fuel is a gas, the critical number density of uranium atoms sets the reactor pressure (p. 24).
Gas-Core Reactor Criticalitypp. 24–29
| Geometry | Wall | Fuel radius ratio | Calculation | Source | Date | Critical mass, kg |
|---|---|---|---|---|---|---|
| Sphere | None | — | Transport | Los Alamos | 1959 | 2.3 |
| — | Transport | UAC | 1966 | 2.6 | ||
| — | Transport | Allison | 1965 | 2.0¹ | ||
| Cylinder² | None | 1.0 | Transport | Los Alamos | 1959 | 2.0 |
| None | 1.0 | Diffusion | NASA | 1962 | 3.0 | |
| Aluminum | 1.0 | Transport | Los Alamos | 1959 | 3.5 | |
| None | 0.5 | Transport | Los Alamos | 1959 | 4.0 | |
| None | 0.5 | Diffusion | NASA | 1962 | 3.5 |
¹ Calculated for plutonium. ² Length-to-diameter ratio 1.
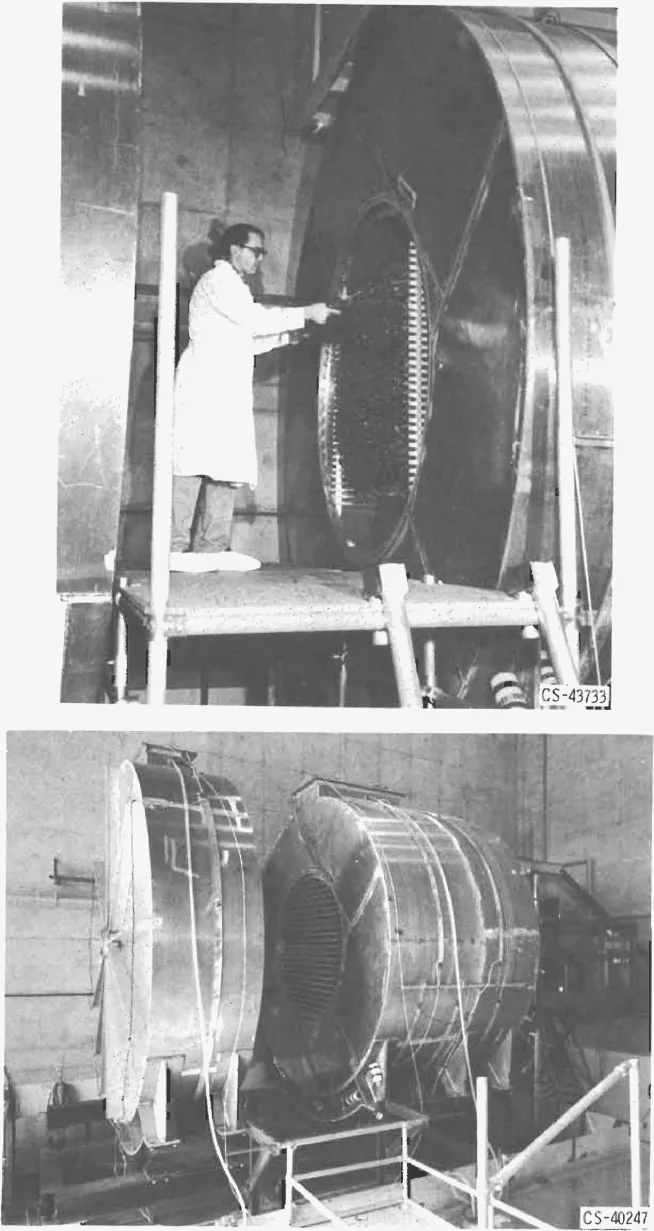
The calculations clustered at 2 to 4 kg, but cavities are unusual geometries and the results are sensitive to composition and temperature. So Lewis had General Electric run a full-size critical experiment at the AEC's National Reactor Testing Site in Idaho: a cavity 6 ft across and 4 ft long, inside a 3-ft D₂O reflector, 12 ft across and 10 ft long overall, holding about 20 tons of heavy water. A minimal aluminium rack held the uranium foils (pp. 25–27).
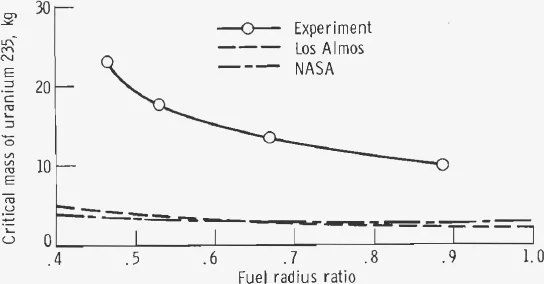
Pressure scales with critical mass, so the surprise carried straight through to the engine. Table III works it out for a D₂O-reflected cavity 8 ft across and 8 ft long, with a 6-ft fuel region and a 3-ft reflector, 14 ft overall. Each row adds one effect (pp. 27–29):
| Case | H₂ temp., °R | U temp., °R | Critical mass, kg | Pressure, atm | N/m² |
|---|---|---|---|---|---|
| Fuel | None | 530 | 9.0 | 0.19 | 19,300 |
| 530¹ | 530 | 11.2 | .24 | 24,300 | |
| 6000 | 80,000 | 16.8 | 54.4² | 5,520,000 | |
| 6000 | 80,000 | 16.8 | 209 | 21,400,000 | |
| Structure | — | — | 32.3 | 404 | 40,900,000 |
| Fuel distribution | — | — | 47.8 | 595 | 60,300,000 |
| 50 percent containment | — | — | 47.8 | 1190 | 120,600,000 |
¹ Hydrogen number density 10²¹ atoms/cm³. ² Assumes no ionization of uranium-235. Kelvin columns omitted: 530 °R = 295 K, 6000 °R = 3330 K, 80,000 °R = 44,400 K.
- ideal-gas value
- selected row
- printed value (Table III)
Hydrogen mixing halves the uranium concentration, so the pressure doubles.
- Ideal-gas value
- 1,185atm
- Table III
- 1,190atm
The conclusion: an 8-ft uranium-235 cavity is not apt to be much less than 1000 atmospheres. Lower pressure needs either less mixing between hydrogen and uranium or a new concept. The report calls the neutronics result a surprise, and expects moderators other than D₂O to give even higher critical masses (p. 29).
Gas-Core Fluid Mechanicspp. 29–32
In the coaxial model, slow uranium enters through a central duct and fast hydrogen flows around it. The velocity difference creates a mixing zone, leaving an undisturbed core where most of the fuel stays (Fig. 21). Lewis simulated this with bromine in air, and the Illinois Institute of Technology with freon in air. At a velocity ratio of 31, the IIT concentration data agree well with Lewis theory (Fig. 22). A calculation at a velocity ratio of 30 and a mass-flow ratio of 35, representative of a gas core, shows the fuel concentrated near the entrance (Fig. 23). The theory assumes temperature gradients and radiation affect mixing only through density and gas properties (pp. 29–32).
Gas-Core Heat Transferpp. 32–34
Hydrogen barely absorbs radiation below about 10,000 °R, so the incoming gas must be seeded with particles. The seed evaporates as it heats and may open a transparent window (Fig. 24, at 500 atm). Knowledge of absorption coefficients is in a very poor state to a physicist, but adequate for engineering studies (pp. 32–33).
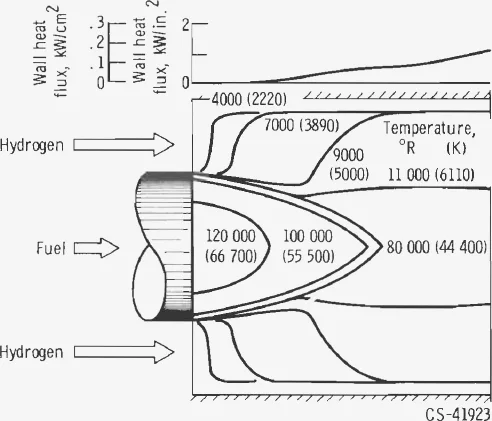
With less than 1 percent seed by mass, the average fuel temperature is about 90,000 °R and the hydrogen averages 10,000–20,000 °R, giving 1500–2000 s. Wall heat flux stays under 1 kW/in² (0.155 kW/cm²), well within what chemical-rocket nozzle cooling already handles. As far as heat-transfer problems are concerned, the coaxial-flow reactor is feasible (pp. 33–34).
Gas-Core Performancep. 34
| Quantity | Estimate |
|---|---|
| Thrust | > 250,000 lbf (> 1,112,000 N) |
| Weight | > 100,000 lb (> 45,360 kg) |
| Thrust per engine weight | 2 to 20 |
| Specific impulse | 1500 to 2500 s |
| Pressure level | 1000 atm (101,330,000 N/m²) |
| Uranium-to-hydrogen flow ratio | 0.01 to 0.10 |
| Average uranium temperature | ≈ 80,000 °R (≈ 44,400 K) |
The text adds that peak uranium temperatures exceed 100,000 °R (p. 34).
Because the reactor's power leaves as thermal radiation, the fuel temperature rises only as about the fourth root of power (p. 34). Thrust is raised by adding hydrogen flow:
Stefan–Boltzmann constant, at fixed radiating area.
Below a uranium-to-hydrogen ratio of 0.01, the report expects no improvement without a breakthrough in uranium holdup. Magnetic or electric fields in the nozzle might be one (p. 34).
Future Prospectspp. 35–36
Whether nuclear rockets fly depends on the need, the cost, and the timing (p. 35). Need: a manned interplanetary mission would have to become a national goal. On the Apollo model, only one or two flights might be approved, and the near planets' hostile environments make many follow-on flights unlikely. Cost: the most optimistic estimates pay for nuclear development with the savings on the first mission; more pessimistic ones need many flights. Chemical rockets carry proven performance and well-founded cost estimates, while no nuclear engine had been developed for flight (pp. 35–36).
when a decision is made to go ahead with the first manned interplanetary mission the chemical rocket will probably be chosen for the powerplantFuture Prospects, p. 35
Timing: only if the decision is delayed long enough could today's advanced concepts, or ones not yet invented, win. The report therefore urges research on advanced nuclear propulsion of all types (p. 36).
Summary of Resultspp. 36–37
| Solid core | Liquid core | Gas core | |
|---|---|---|---|
| Specific impulse | ≈ 850 s | 1200–1500 s | 1500–2500 s |
| Thrust | any, > 10,000 lb | any | > 100,000 lb |
| Thrust-to-engine weight | 2–20 | 1–10 | 1–20 |
| Uranium loss per lb H₂ | negligible | 0.01–0.1 lb | 0.01–0.1 lb |
| Status | breadboard engine > 700 s at ≈ 50,000 lb | calculations | calculations and lab experiments |
The sections themselves quote 800–900 s and 10–20 for developed solid cores (p. 15), and 1300–1500 s with 2–10 for liquid cores (p. 21).
What those impulses mean for a vehicle follows from the rocket equation. For a velocity change , the propellant needed per unit of burnout mass (everything left at the end, including engine, tanks and payload) is
- Chemical H₂–O₂ · 450 s
- Solid core · 800–900 s
- Liquid core · 1200–1500 s
- Gas core · 1500–2500 s
- Chemical H₂–O₂
- 8.6× burnout
- Solid core
- 2.1–2.6× burnout
- Liquid core
- 1.0–1.3× burnout
- Gas core
- 0.5–1.0× burnout
- Uranium lost, gas core, per tonne burnout
- 5–97kg
Assumptions and open questions
Key assumptions
- Specific impulse is the main figure of merit: the aim of any rocket is the highest impulse, so that a mission needs the least propellant (p. 1).
- Solid-core hydrogen temperatures of about 5000 °R are set by fuel-element materials that can run near 5500 °R (pp. 3, 6).
- The solid-core thrust-to-weight curves are calculations, taken as the best obtainable; the first engines are expected to fall lower (p. 14).
- Liquid-core results are calculated at 200 atm, with UC diluted to a 0.02 mass ratio in NbC and radiation tubes 2 in. across and 60 in. long (pp. 18–21).
- Gas-core critical masses are extrapolated from a room-temperature, D₂O-reflected cavity experiment. Pressures treat the uranium as a vapour filling the fuel region, adding in turn hydrogen, operating temperature, ionization, a wall equivalent to 1.5 cm of aluminium, non-uniform fuel and 50 percent containment (pp. 27–29).
- The coaxial-flow theory treats mixing as isothermal; temperature gradients and radiation enter only through density and gas properties (p. 32).
- Calculated absorption coefficients are taken as adequate for engineering studies, with seed below 1 percent of the hydrogen flow (pp. 33–34).
- The mission outlook assumes one or two manned interplanetary flights, with cost compared in qualitative terms (p. 35).
Where further work would help
- Gas-core criticality. The measured critical masses come from one D₂O-reflected geometry at room temperature. Further experiments with hot hydrogen, real wall structure, other reflector materials and uranium-233 would show how the roughly 1000-atm estimate shifts. The report notes the uranium-233 gain cannot be determined until the reactor can be calculated satisfactorily (p. 29).
- Mixing at operating conditions. The coaxial-flow theory was checked with bromine and freon in air at velocity ratios near 30. Extending it to radiating, partly ionized uranium and hydrogen at high pressure would show how far the predicted fuel holdup, and so the 0.01–0.1 uranium loss ratio, carries over.
- Radiation properties. The heat-transfer result rests on absorption coefficients for hydrogen, uranium and seed at 10,000–100,000 °R, which the report describes as poorly known to physicists. Measurements, including whether evaporating seed opens a transparent window, would test the conclusion that wall heat flux stays below 1 kW/in² (pp. 32–33).
- Liquid-core uranium loss. Figs. 15–17 are calculated at a single pressure and dilution. Experiments, and calculations at other pressures, dilutions and tube sizes, would show how sensitive the 1-in-50 uranium fraction and the 1300–1500 s range are.
- Solid-core life and weight. At the time of writing, total full-power time across all reactors was about two hours (p. 10). Longer runs, many restarts and measured engine weights would show where real powerplants fall on Fig. 10 and how long fuel elements last.
- Hydrogen at very high temperature. The impulses claimed for liquid and gas cores depend on hydrogen's behaviour at 9000–23,000 °R and on nozzle conditions. Establishing those would show how directly the solid-core figures extrapolate upward.
- From impulse to missions. The report compares powerplants rather than vehicles. Mission studies that include engine weight, shielding, uranium loss and trip time would show how the impulse advantage translates into vehicle mass and cost.
What happened next
- 1968
As the report goes to press, its footnotes record NRX-A6 running 60 minutes at full power, Phoebus 2A running 12 minutes above 4000 MW, and NERVA II dropped for a 1500-MW, 75,000-lb NERVA. NASA's 1991 history counts NRX-A6, the last of its series, as having run one hour continuously, with an extrapolated life of 2–3 hours.
- 1969
The XE engine, which closely simulated a flight system, fires in the new down-firing Engine Test Stand 1 at the Nuclear Rocket Development Station, Jackass Flats, Nevada: 115 minutes of running and 28 starts. NASA's history calls it confirmation that a nuclear rocket could fly at twice the specific impulse of chemical engines.
- 1972
NASA's 1991 history dates the Nevada test period from 1959 to 1972. At Lewis, its historian calls 1972 one of the darkest years in the center's history, the year NASA slated Lewis's Plum Brook Station for closing.
- 1973
NASA lays off 400 Lewis staff working on space nuclear power and propulsion.
- 1991
Looking back from NASA's Space Exploration Initiative, Robbins and Finger count the legacy as twenty reactor tests and two full-scale engine tests. Nuclear thermal propulsion is again named an enabling technology for crewed missions to Mars.
Sources
- F. E. Rom, Nuclear-Rocket Propulsion, NASA TM X-1685 (1968)
- W. H. Robbins & H. B. Finger, An Historical Perspective of the NERVA Nuclear Rocket Engine Technology Program, NASA CR-187154 (1991) · pp. 1, 8, 10–12
- V. P. Dawson, Engines and Innovation: Lewis Laboratory and American Propulsion Technology, NASA SP-4306 (1991) · pp. 184–185, 201
- R. G. Ragsdale, Performance Potential of a Radiant-Heat-Transfer Liquid-Core Nuclear Rocket Engine, NASA TN D-4148 (1967) · the report's ref. 2
- NASA Image Library: Kiwi B-1-B nozzle at Lewis, 1964