
At a glance
- Category
- A summary-and-correlation report: part handbook, part review. It adds some original method (the derivation of the 6-series thickness forms, and a rapid hand method for pressure distributions) and a large supplement of design data. In the authors' words, its aim is to summarize these data and to correlate and interpret them insofar as possible (p. 1).
- Context
- It builds on NACA Report 460 (Jacobs, Ward & Pinkerton, 1933) for the four-digit family, Theodorsen's conformal-mapping theory of arbitrary airfoils, classical thin-airfoil theory, Allen's simplified pressure method, and von Kármán's 1941 compressibility work. Most of its data come from Langley's new two-dimensional low-turbulence tunnels.
- Contributions
- One catalogue and naming system for the NACA four-digit, five-digit, 16-, 6- and 7-series airfoils.
- Published methods for deriving the 6- and 7-series thickness forms by conformal mapping, including the closed-form a mean lines of eq. (6).
- A rapid superposition method, eq. (14), for estimating pressure distributions by hand, with the data it needs tabulated for every section.
- Systematic smooth and rough two-dimensional data at Reynolds numbers up to 9 million, and higher for some sections.
- The central finding: surface condition affects lift and drag at least as much as airfoil shape. It comes with practical finish criteria: No. 320 sandpaper, a straightedge test, and hand inspection for specks.
Summaryp. 1
Recent airfoil data, mostly from the Langley two-dimensional low-turbulence pressure tunnel plus wake-survey flight measurements, are collected and correlated. Detailed design data are given for the NACA 6-series, with recent data for the 00-, 14-, 24-, 44- and 230-series. The report covers how the 6- and 7-series shapes were derived, how to estimate pressure distributions quickly, and lift, drag, moment, critical speed, surface condition and high-lift devices.
Most of the data on airfoil section characteristics were obtained in the Langley two-dimensional low-turbulence pressure tunnel.Summary, p. 1
The headline is a warning as much as a result. Laminar-flow sections give much lower drag if, and only if, the wing surfaces are sufficiently smooth and fair.
Introduction and Symbolspp. 1–2
Earlier results were scattered across reports with limited objectives, which had prevented adequate analysis and interpretation. Numbered figures illustrate the text, while the design data sit in five unnumbered supplements (I–V) arranged by airfoil (p. 1). Two pressure coefficients recur throughout. is the usual one. equals at low speed, so means local suction. is the resultant load (lower minus upper surface).
Historical Developmentpp. 2–3
Systematic work on the four-digit family began in 1929 in Langley's Variable-Density Tunnel, with every section sharing one thickness distribution. A forward-cambered five-digit family followed. Some of its sections showed a large sudden loss in lift at the stall. Comparing drag at low lift with flat-plate skin friction showed that nearly all profile drag was skin friction. Lower drag therefore meant keeping the boundary layer laminar further back, which takes favourable pressure gradients and very low stream turbulence.
That led to two new tunnels in which a model spans the narrow test section, removing tip and support corrections. It also led to new shapes. The 16-series was the first low-drag, high-critical-speed family. The 2- to 5-series, designed with approximate theory, were already considered obsolete by 1945: their maximum lift was low, and they assumed more laminar flow than a real surface could keep. The 6-series came from improved conformal-mapping methods, and the 7-series pushes laminar flow onto the lower surface as well (pp. 2–3).
Description of Airfoilspp. 3–7
Method of combining mean lines and thickness distributionsp. 4
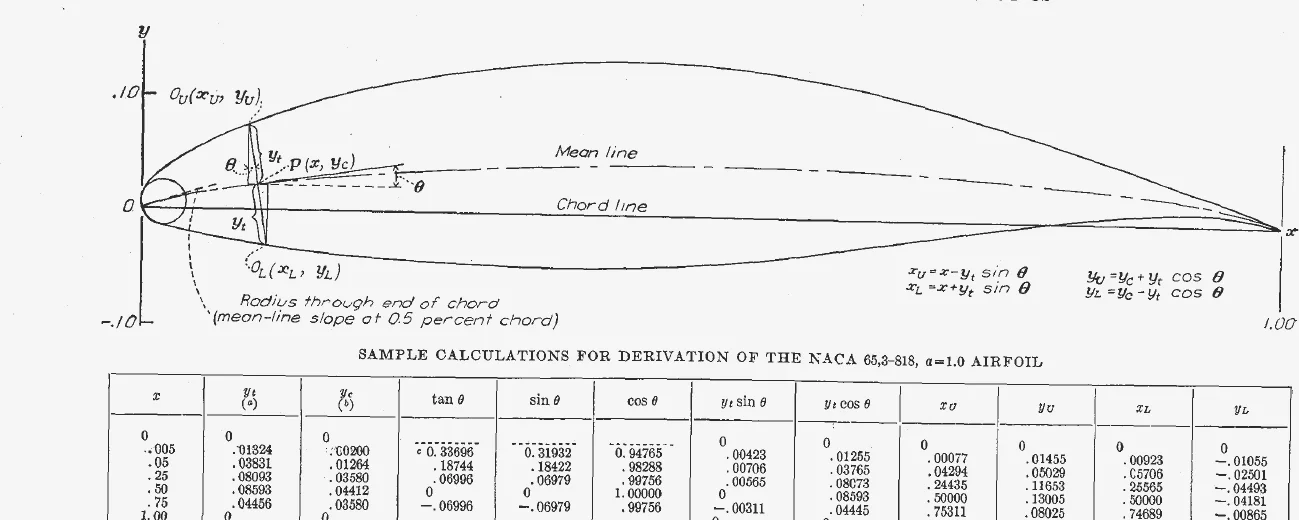
Every NACA section is a symmetric thickness form wrapped around a mean (camber) line . The thickness is laid off perpendicular to the mean line, whose local slope is :
The leading-edge radius is centred on a line through the chord's end with the mean-line slope there. For mean lines with an infinite leading-edge slope, the slope at is used. So cambered sections poke slightly ahead of the leading-edge point.
NACA four-digit series airfoilspp. 4–5
In a designation such as NACA 2415, the first digit is the maximum camber in percent of chord, the second its position in tenths of chord, and the last two the thickness in percent. Report 824 tabulates the shapes but does not print their equations. Those come from Report 460 (1933). The thickness of a section with thickness ratio is
in fractions of chord. Maximum thickness falls at 30% chord, and the trailing edge keeps a small finite thickness (0.126% of chord for the 0012).
The mean line is two parabolas, with maximum camber at position : ahead of and behind it. Thicker or thinner forms scale linearly, and the leading-edge radius varies as the square of the thickness ratio: 1.58% of chord for the 0012 (p. 5).
NACA five-digit and 1-series airfoilsp. 5
In the five-digit 23012, the first digit × 3/2 gives the design lift coefficient in tenths (). The next two digits, halved, give the maximum-camber position in percent of chord (15%), and the last two the thickness (12%). The family uses the four-digit thickness forms with forward-cambered mean lines. The 1-series, such as the 16-212, gives the minimum-pressure position in tenths of chord (6), then the design lift in tenths (0.2), then the thickness. It is normally cambered with the mean line. (These are two headings in the report, merged here.)
NACA 6-series airfoilspp. 5–7
Take the NACA 65,3-218, a = 0.5. The 6 is the series. The 5 is the minimum-pressure position in tenths of chord on the symmetric form at zero lift. The 3 is the half-width, in tenths, of the lift range over which favourable gradients exist on both surfaces. The 2 is the design lift coefficient in tenths, and 18 the thickness. Leaving out implies .
The a mean lines carry a load that is uniform from the leading edge to and then falls linearly to zero at the trailing edge. Their shape has a closed form:
, . The ideal angle of attack is .
The 7-series (for example 747A315) gives the extent of favourable gradient on the upper and lower surfaces separately (4 and 7 tenths), plus a serial letter. Its mean lines are sums of a lines. The 747A315 uses at 0.763 and at −0.463, which add up to its design lift of 0.3 (Table I, p. 7).
Theoretical Considerationspp. 8–15
Pressure distributionspp. 8–13
The 6-series thickness forms were designed rather than found by trial. Theodorsen's method maps a circle to a near-circle and then to an airfoil: , , . The designer chooses , integrates to find the shape, and iterates. The velocity at the surface is
One design lesson stands out: there is an optimum leading-edge radius. Too small, and a suction peak forms right at the nose. Too large, and the peak sits a few percent behind it. Simply scaling a form's ordinates to make it thicker lowers its critical speed unnecessarily, which is why later families scale the mapping functions instead (pp. 8–9).
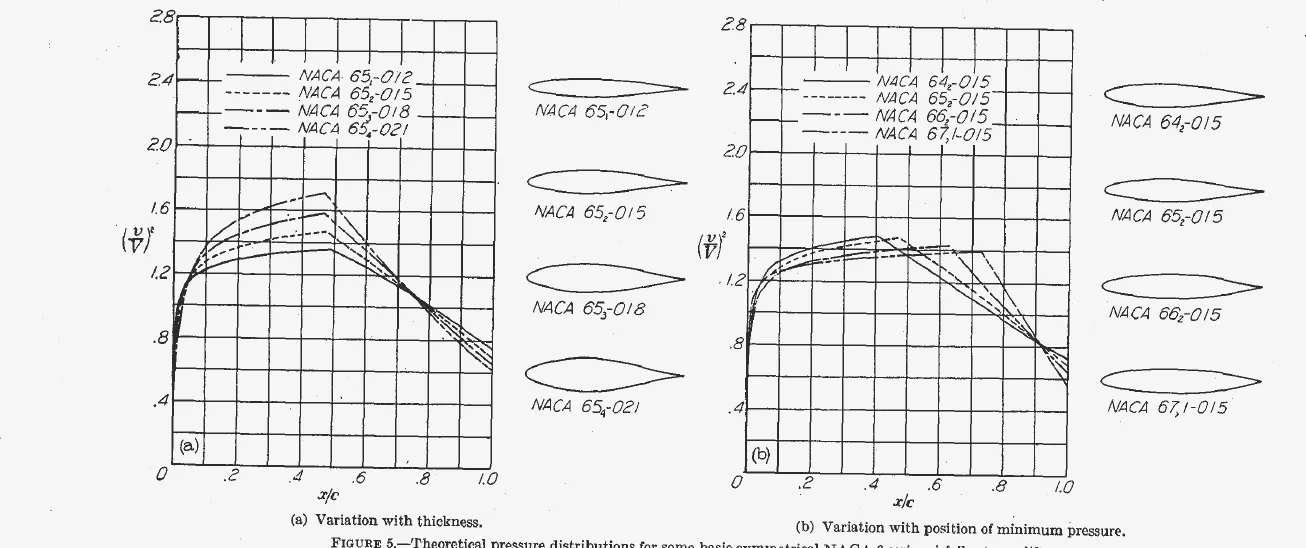
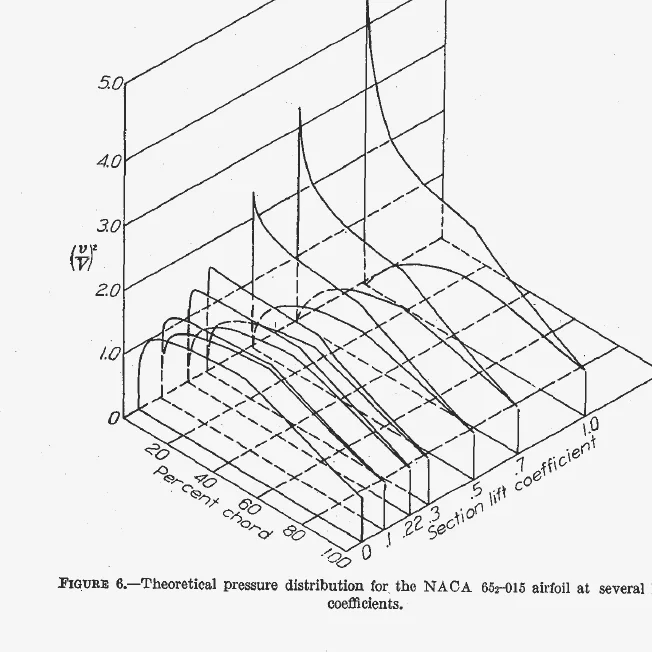
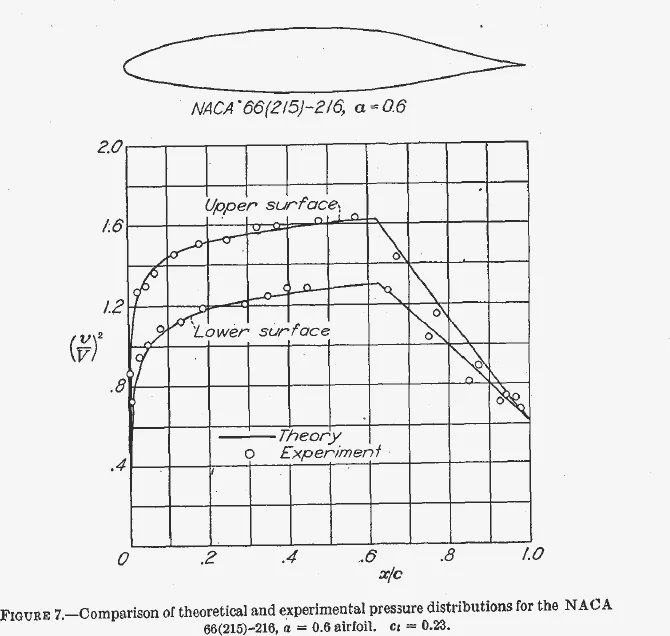
Rapid estimation. For design work the report superposes three tabulated velocity increments: the basic thickness form at zero lift (), the mean line's design load (), and an additional load from angle of attack ():
Upper signs for the upper surface. Increments at the same are added and assigned to the surface point at that .
Critical Mach numberpp. 13–14
The critical Mach number is the free-stream Mach number at which the surface flow first reaches sonic speed. It is predicted from the peak low-speed with von Kármán's compressibility rule, and supplement IV charts the result. It predicts where sonic flow first appears, but not where large changes in characteristics occur, especially with sharp nose peaks. The 6-series reaches considerably higher maximum critical Mach numbers than the 24-, 44- and 230-series of equal thickness. On that chart, the 0012 at zero lift (peak ) first reaches sonic flow at about Mach 0.73.
Moment coefficients and angle of zero liftp. 14
Both come from thin-airfoil theory via the mean-line tables and scale with camber: the NACA 4415 has . With the thin-airfoil lift slope of per radian, the angle of zero lift in degrees is
For the 2415: and , so . The report warns against using such values to set washout without experimental verification.
Description of flow around airfoilsp. 15
At low and moderate lift on a smooth section, the boundary layer stays laminar to about the first minimum-pressure point, then separates and reattaches almost immediately as turbulent flow. Drag is mostly skin friction, set by how much of the surface stays laminar. Raising the angle of attack moves the upper-surface minimum pressure forward. On 6-series sections transition jumps forward suddenly at the end of the low-drag range, which produces the characteristic drag bucket. At high lift, separation and form drag take over.
Experimental Characteristicspp. 16–51
The primary source is the Langley two-dimensional low-turbulence pressure tunnel, with design data from 2-foot-chord models. Flight drag comes from wake surveys on wings or gloves, reduced with compressible-flow methods (p. 16).
Drag characteristics of smooth airfoilspp. 16–22
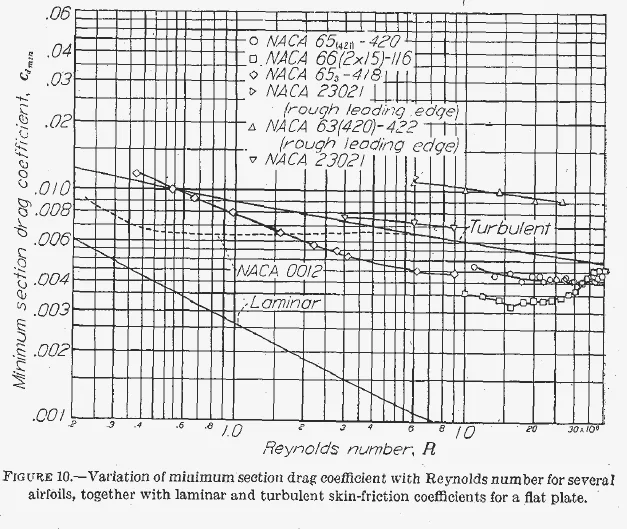
In the low-drag range, drag depends mainly on Reynolds number and the extent of laminar flow, and only moderately on thickness and camber. Moving minimum pressure aft cuts minimum drag steadily: at , from roughly 0.005 for the 63-series toward 0.0035 for the 67-series (Fig. 9). The theoretical low-drag range is about 0.2 in for 12% thickness, widening by about 0.2 for every 3% of extra thickness. At it shrinks to about one-half the theoretical value (Fig. 14).
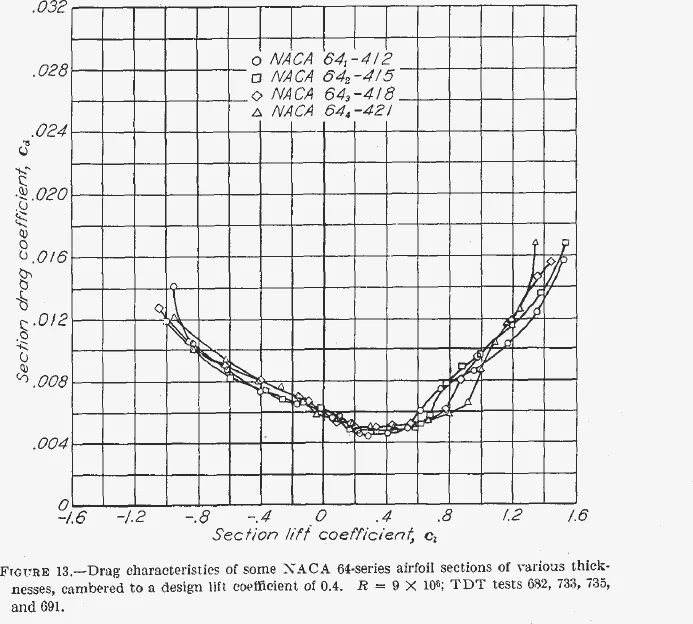
The report also tests effective aspect ratio as a selection figure, fitting through polars at and 1.0 (eq. 17). For an aspect-ratio-10 airplane the 23018 scores 9.29 but a maximum of 18.5, while the 65₃-418 scores worse (8.30) yet reaches . Effective aspect ratio, the report concludes, is not a satisfactory criterion for choosing a section (p. 21).
Effect of surface irregularities on dragpp. 22–30
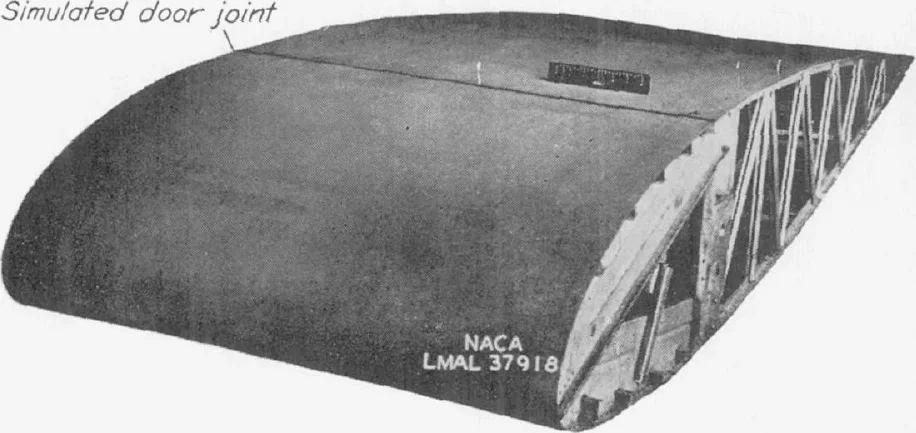
This is the most practical part of the report. Large models were finished by sanding chordwise with No. 320 carborundum paper. Polishing or waxing a properly sanded surface gave no further gain. Protuberances are worse than dents, and dust on a fingerprint can trip transition. Turbulence spreads behind a disturbance in a wedge of about 15°. Fairness is checked with a straightedge rocked chordwise: it should move without jarring or clicking.
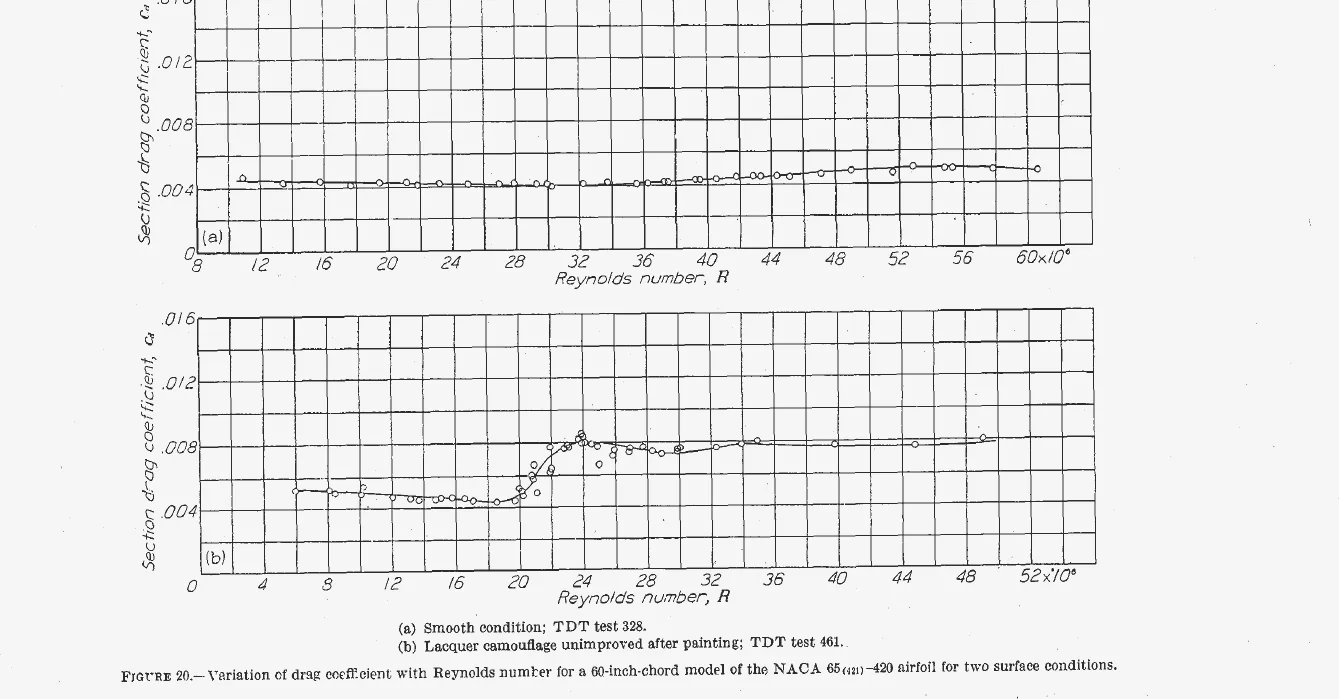
To compare sections fairly when rough, the report defines a standard roughness: 0.011-inch carborundum grains applied to the airfoil surface at the leading edge over a surface length of 0.08c … thinly spread to cover 5 to 10 percent of this area. That is worse than ordinary manufacturing flaws but milder than ice, mud or combat damage (p. 24).
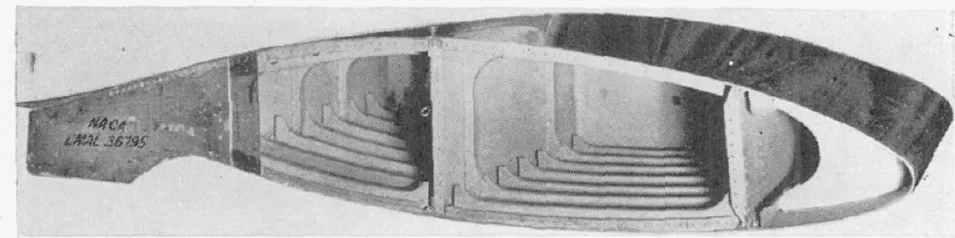
Wing sections built like real aircraft, delivered to the tunnel without special finishing, showed minimum drag of the order of 0.0070 to 0.0080 in nearly all cases regardless of section. None was fair at the front spar. One 66-series specimen with no spar ahead of about 35% chord kept low drag up to (pp. 24–29).
Lift characteristics of smooth airfoilspp. 30–37
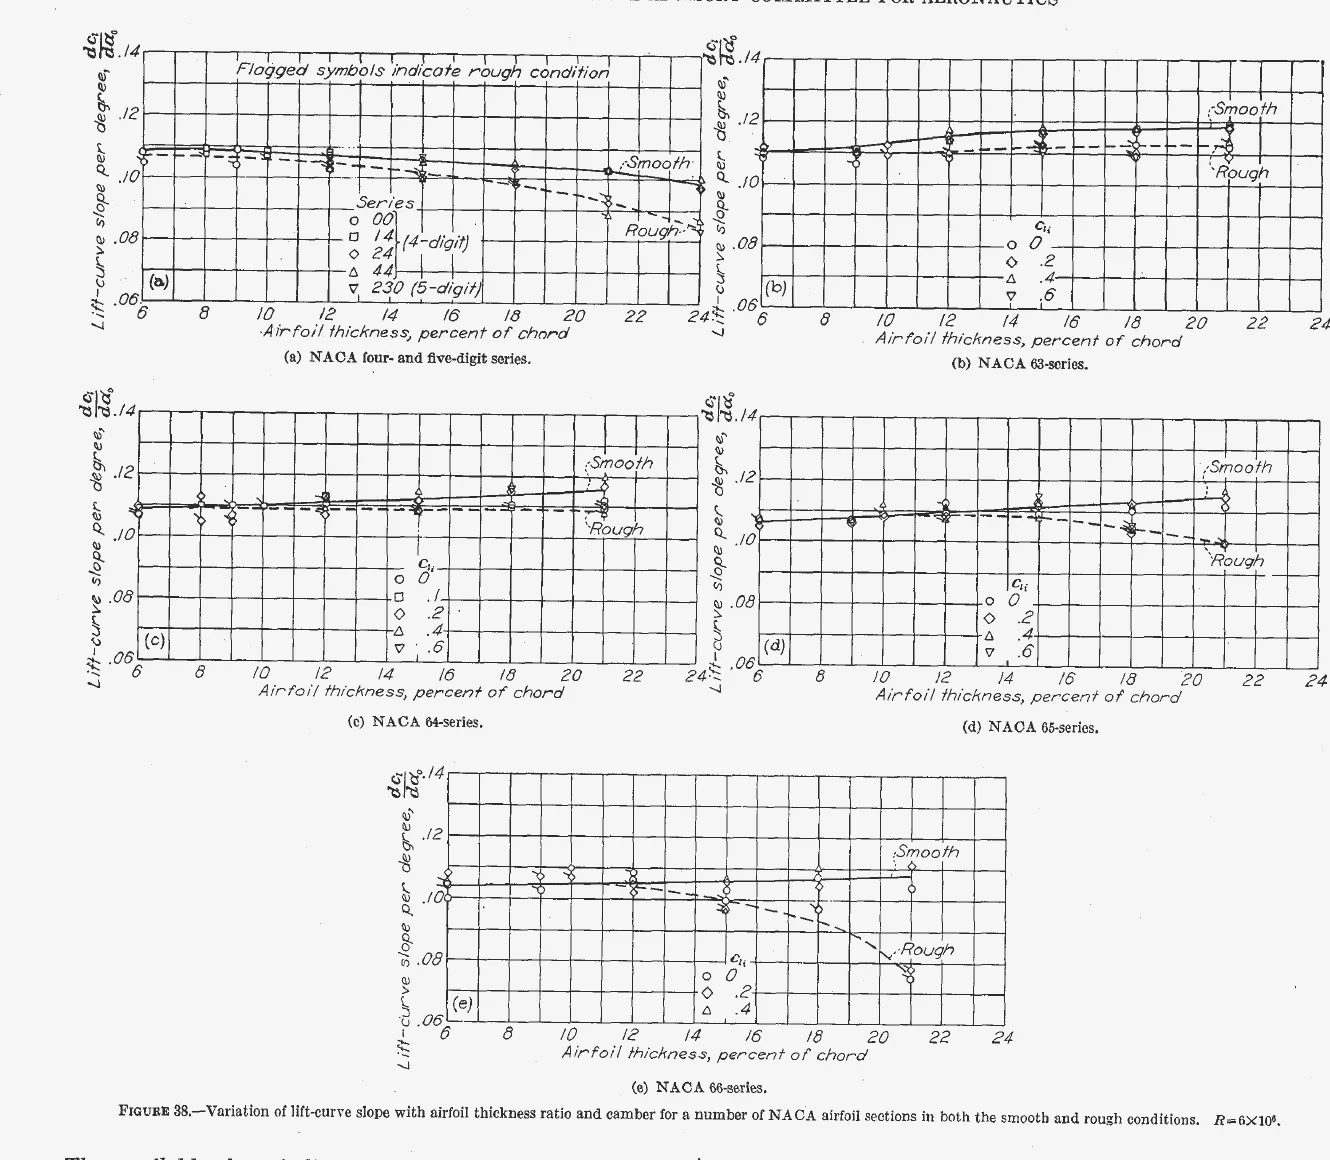
Angle of zero lift is set mostly by camber, with thickness having little effect. Measured values relative to thin-airfoil theory are about 0.93 for the four-digit series, 1.08 for the 230-series and 0.74 for 6-series sections with the uniform-load mean line (p. 30). Lift-curve slope for 6–10% sections of the four-digit, five-digit and 64-series is very close to the thin-airfoil value of per radian, 0.110 per degree. It falls with thickness for the older families and rises for the 6-series.
Maximum lift. At the plain four- and five-digit sections peak at 12% thickness. The best combination overall is about 12% thick with . Raising from 3 to 9 million adds roughly 0.15–0.20 to for the 24-, 44- and 230-series. A rectangular wing of aspect ratio 6 is predicted to reach 4–7 percent less than its section (pp. 33–37).
Lift characteristics of rough airfoilspp. 37–39
Leading-edge roughness cuts heavily, by about the same amount with or without a 60° split flap, and lowers the lift-curve slope, especially for thick sections with minimum pressure far aft. A full-scale fighter in service condition reached a more than 0.2 lower than its tunnel model. Sealing leaks helped. Roughness strips behind 20% chord barely mattered.
Unconservative airfoilspp. 39–40
An unconservative section is excellent when smooth but has excessive drag at climb and cruise lift when rough. The report's yardstick is the lift coefficient at which the rough-leading-edge drag reaches 0.02. It peaks at 12–15% thickness and drops as minimum pressure moves aft. That matters for thick root sections on long-range airplanes.
Pitching moment and aerodynamic centerpp. 40–43
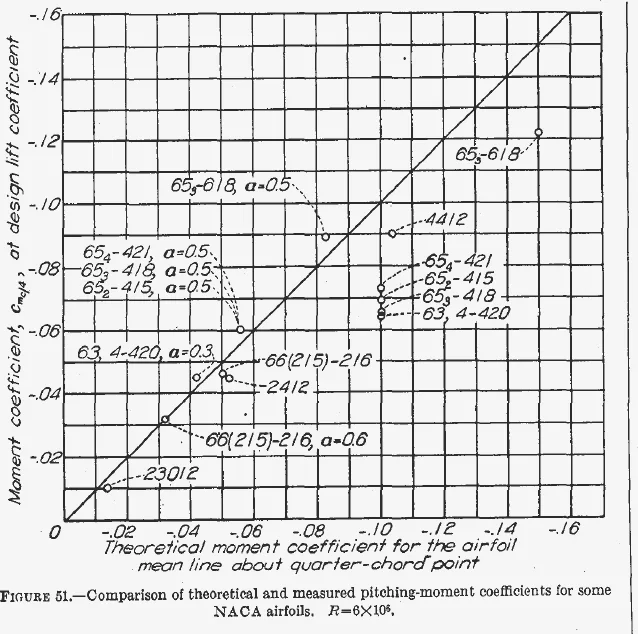
Measured for 6-series sections with is about three-quarters of the theoretical value. The older families also fall short of theory but agree better. The aerodynamic center lies slightly ahead of the quarter chord for the 24-, 44- and 230-series and slightly behind it for the 6-series (about 0.25–0.28c), moving further as thickness grows (pp. 40–43).
High-lift devicespp. 43–47
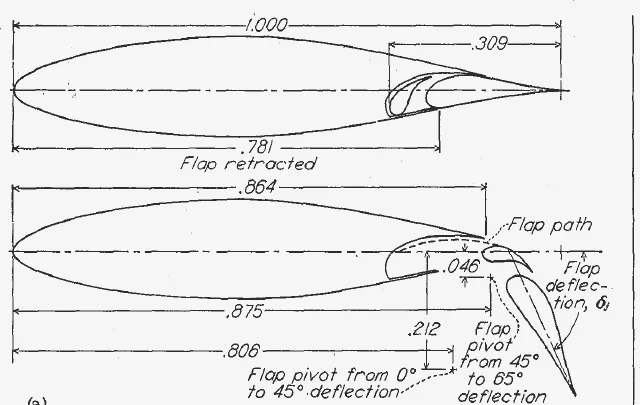
On 6-series sections, a 0.25c single slotted flap on the 63,4-420 reached , and a 0.309c double slotted flap on the 65₃-118 reached 3.28. The report concludes no special difficulties exist in obtaining high maximum lift with slotted flaps on moderately thick 6-series sections. Split-flap increments on 12% sections were only about three-quarters of those on a 16% section.
| Model | Sections | Flaps | R × 10⁻⁶ | C_L,max | Stall |
|---|---|---|---|---|---|
| I | 66(215)-216, A = 7 | none | 4.6 | 1.41 | abrupt, root to tip |
| I | 66(215)-216 | split 60°, 0.20c, inboard + outboard | 4.6 | 2.51 | abrupt, root to tip |
| II | 66(215)-116 / -216, λ = 0.5 | Fowler 30° / 30° | 3.4 | 3.29 | extremely abrupt |
| VII | Mod. 65,3-318 / 65(318)-316 | double slotted 55° / 30° | 5.1 | 2.85 | satisfactory |
| XV | 23015.6 / 23009 | slotted 50° | 5.6 | 2.52 | very abrupt |
Stall notes in Table II range from satisfactory to extremely abrupt, depending on planform and flap arrangement.
Lateral-control devices, leading-edge air intakes, and interferencepp. 43–51
Three short sections, merged here. Aileron effectiveness falls below thin-airfoil theory, with no large consistent dependence on section shape. Leading-edge air intakes can work but cannot yet be designed without experimental development. Interference with fuselages and nacelles is similar for conservative 6-series sections and other good airfoils.
Application to Wing Designpp. 51–52
Section data feed lifting-line methods for zero-lift angle, lift slope, moment and drag. Choose the root section as thick as is aerodynamically feasible. For high-speed airplanes the critical Mach number is the binding limit; for slower ones it is drag with a rough surface. The tip section wants high and a gentle stall, so camber is the main lever there. Forward camber (the 230-series) risks sudden stall. Suggested pairings are a 230-series root with a 44-series tip, or a 63-series root with a 65-series tip. High taper combined with large sweep is singled out as particularly bad.
Conclusionspp. 52–53
- Laminar-flow 6- and 7-series sections cut drag at high-speed and cruise lift only with fair, smooth surfaces.
- Full-size wings can get extensive laminar flow when sanded chordwise with No. 320 carborundum paper and free of specks.
- With current construction, moderately thick wings reach of the order of 0.0080, set by surface condition rather than section.
- Smoothing pays at high Reynolds number even without laminar flow.
- Smooth, moderately cambered 6-series sections () reach as high as the 24- and 44-series.
- With flaps, thick 6-series sections match the 23012's , but thinner ones fall well short.
- 6-series lift-curve slopes slightly exceed those of the older families and usually exceed thin-airfoil theory.
- Leading-edge roughness causes large losses, the same with or without split flaps.
- Roughness lowers the lift-curve slope, most for thick sections with minimum pressure aft.
- Predicting a real wing requires knowing its surface condition.
- 6-series sections have higher critical Mach numbers at cruise lift. (Points 12–15 cover high-lift critical speed, ailerons, interference and intakes.)
Appendix: Methods of Obtaining Data in the Langley Two-Dimensional Low-Turbulence Tunnelspp. 54–60
Two closed-throat tunnels, the LTT and the TDT, share a 3 ft × 7½ ft test section. A contraction of about 20:1 and fine screens keep turbulence to only a few hundredths of 1 percent. The TDT runs at up to 10 atmospheres and about 300 mph at atmospheric pressure. Standard tests use 2-ft-chord wooden models at up to (at 4 atmospheres). Lift comes from floor and ceiling pressures, drag from a wake-survey rake, and moments usually from a balance (p. 54).
Lift. The model's lift appears as a pressure reaction on the floor and ceiling, integrated over about 13 ft by an integrating manometer. Because the orifices cannot extend to infinity, the reading is a fraction of the true lift. That fraction is found from an image system of vortices that mimics the tunnel walls:
is the tunnel height. For a 2-ft model, for the additional load and –0.935 for the basic load, depending on .
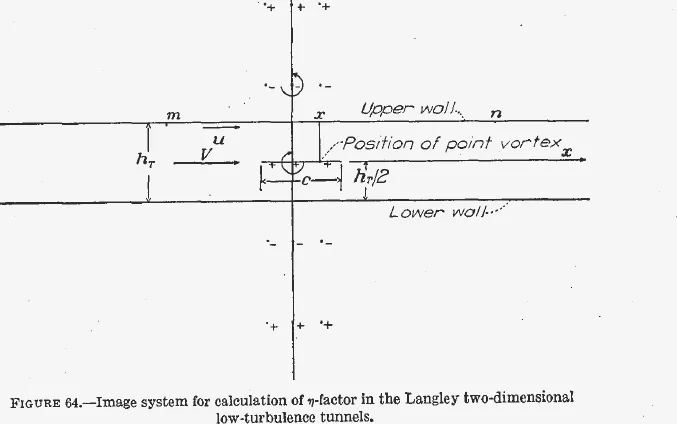
Drag. A rake of total-pressure tubes surveys the wake behind the model. The drag coefficient follows from the momentum deficit, corrected with a factor that assumes a Gaussian wake profile (eqs. 25–27).
Wall corrections. The walls speed up the flow past the model (blocking) and curve the streamlines. For a model of chord in a tunnel of height , , which is 0.0146 for a 2-ft model. With a shape factor and for the static-orifice position, the corrections are
Assumptions and open questions
Key assumptions
- Eq. (14) adds the thickness, camber and angle-of-attack effects on surface velocity linearly. The authors note this superposition has inadequate theoretical justification yet works well in practice (p. 11).
- The additional load is scaled by , treating the tabulated as corresponding to a unit additional lift coefficient, which it does only approximately (p. 5).
- Mean-line design values (, , ) come from thin-airfoil theory, which ignores thickness and the boundary layer.
- Wake-survey drag assumes a Gaussian total-pressure profile and uniform static pressure across the wake (eqs. 25–27).
- A single standard roughness stands in for service deterioration, and permissible roughness is presumed to scale with chord (pp. 22–24).
- Most measurements are at Reynolds numbers of 3 to 9 million (p. 52).
Where further work would help
- Flight Reynolds numbers. The low-drag range keeps shrinking with Reynolds number (to about half its theoretical width at 35 million), so applying the 3–9 million data to larger, faster airplanes calls for tests at higher Reynolds number.
- Real surfaces. The report shows surface condition matters at least as much as shape. How a given production finish, paint system or level of wear maps onto the standard roughness would need direct measurement.
- Three-dimensional wings. Section data feed lifting-line methods, but Table II's stall behaviour varies with planform and flap arrangement. The report itself asks for systematic high-Reynolds-number three-dimensional data (p. 37).
- Gaps in the families. Mean lines with , quantitative waviness criteria, and design rules for leading-edge air intakes are all named as needing further study (pp. 28, 34, 50).
- Above the critical Mach number. The critical-Mach predictions mark where sonic flow first appears. What happens beyond it was outside the report's scope.
What happened next
- 1929
Systematic four-digit tests begin in Langley's Variable-Density Tunnel (Report 824, p. 2).
- 1933
NACA Report 460 publishes 78 related sections and the four-digit equations.
- 1942
Jacobs, Abbott & Davidson issue preliminary low-drag data from the low-turbulence tunnels. Report 824's wartime version supersedes it.
- 1945
Report 824 is signed on 5 March 1945.
- 1959
Abbott & von Doenhoff's Theory of Wing Sections, including a Summary of Airfoil Data appears from Dover. NASA Langley later called the 1945 report one of the most important NACA reports ever written.
Sources
- NACA Report 824 on NTRS · Public use permitted
- NACA Report 460: The characteristics of 78 related airfoil sections (1933) · Source of the four-digit equations
- NASA Langley: Ira H. Abbott