
At a glance
- Category
- A NASA Technical Memorandum collecting eleven symposium papers by Flight Research Center and Air Force Flight Test Center engineers and pilots. Session I (papers 1–7) reports flight-test results from the lifting bodies; Session II (papers 8–11) applies them, with other low-L/D flying, to the proposed Space Shuttle. It is part data report, part flight-versus-wind-tunnel correlation, and part recommendation to Shuttle designers.
- Context
- The lifting-body shapes came from Ames (the M2) and Langley (the HL-10) and from the Air Force SV-5 (the X-24A) (p. 1). The lightweight M2-F1 had shown in 1963 that a pilot could flare and land such a shape. The heavyweight rocket-powered vehicles then flew from a B-52 starting in 1966 (pp. 3–4). In mid-1970 the Shuttle's Phase B studies were weighing high-cross-range orbiters and air-breathing landing engines (pp. 109, 148–149).
- Contributions
- Flight-measured lift, drag and L/D for three full-size lifting bodies, compared with both small-scale and full-scale wind-tunnel tests of the same shapes (Paper 4).
- Flight-identified stability and control derivatives, and the handling problems they explain: the M2-F2's roll reversal and pilot-induced oscillation, the HL-10's tip-fin flow separation, and the X-24A's aileron yaw of opposite sign to prediction (Papers 2, 3, 7).
- Fin loads and hinge moments measured in flight, including a rocket-power effect on hinge moments (Paper 5).
- A worked-out unpowered approach technique: high key and low key, a 270–300-knot final at 10–25°, a 1.5-g flare at 1,000 ft and a float to touchdown, with miss distances under 250 ft (Paper 6).
- Evidence from the HL-10 with landing rockets, and from B-52, CV-990, F-104 and F-111A simulations, that unpowered and instrument (IFR) approaches are practical for a large low-L/D vehicle (Papers 8, 9).
1. Background and Current Status of the Lifting Body Programpp. 1–10
John McTigue opens with the history. Ames developed the lifting-body idea from 1957 to 1964: start from a cone, then modify it for lift and control, which gave the M-2 shape. To find out whether a pilot could maneuver, flare, and land this class of vehicle, the Flight Research Center built the lightweight M2-F1 in 1962–63 and flew it in the summer of 1963. Its success led to heavier vehicles at mission-like weight and wing loading (p. 1).
Objectives of test programp. 1
- Investigate the approach and landing task, including landing techniques and pilot procedures.
- Evaluate handling below a Mach number of about 2.0.
- Determine flight-control-system requirements.
- Correlate wind-tunnel and flight performance, control-surface loads and stability and control data. Before this program there had been no actual flight experience with lifting bodies, so tunnel data had nothing to be checked against.
Description of vehiclespp. 2–3
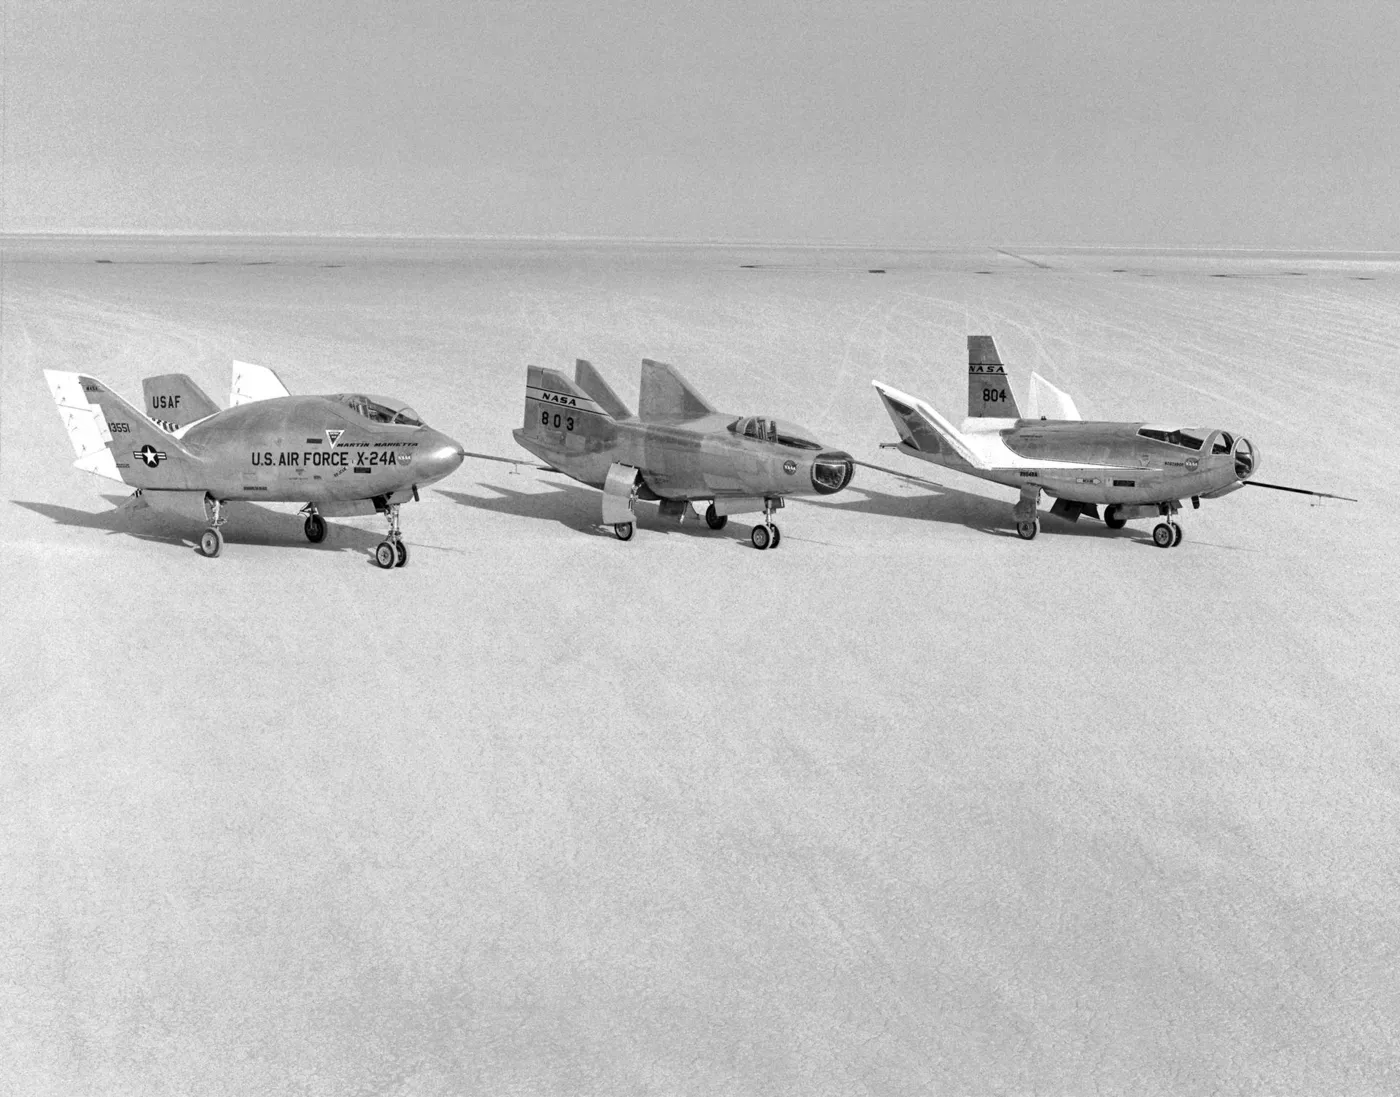
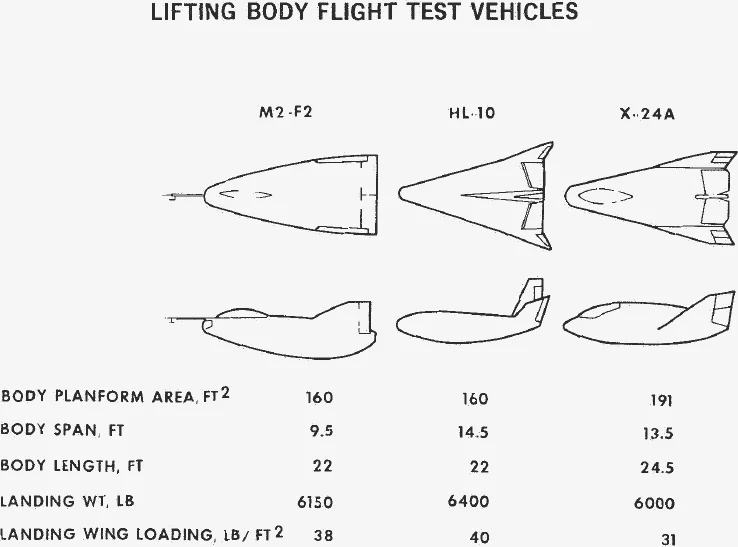
All three represent proposed entry vehicles with a moderate, hypersonic lift-to-drag-ratio (1.1 to 1.3) that can still land horizontally without power. All have blunt noses, thick control surfaces and squared-off thick bases. The differences: the M2-F2 is a half-cone, the HL-10 has negative camber, and the X-24A positive camber (p. 2).
| M2-F2 | HL-10 | X-24A | |
|---|---|---|---|
| Body planform area, ft² | 160 | 160 | 191 |
| Body span, ft | 9.5 | 14.5 | 13.5 |
| Body length, ft | 22 | 22 | 24.5 |
| Landing weight, lb | 6,150 | 6,400 | 6,000 |
| Landing wing loading, lb/ft² | 38 | 40 | 31 |
Wing loading here means landing weight divided by body planform area: 38.4, 40.0 and 31.4 lb/ft².
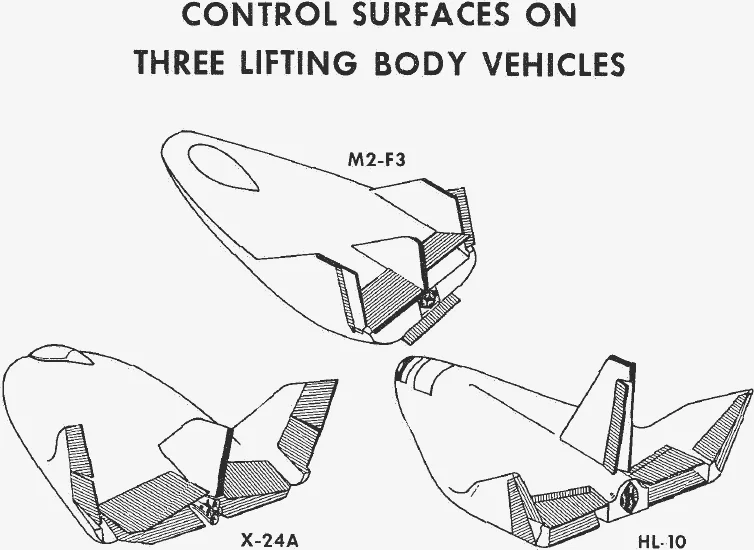
Control layouts differ (Fig. 3). On the M2-F3 a lower flap gives pitch control, and two upper flaps move together for pitch trim and differentially for roll. Rudders on the outboard fins give yaw, with a rudder-to-aileron interconnect. The HL-10 uses elevons for pitch and roll and a split rudder on its centre fin, which doubles as a speed brake. Extra flap-like surfaces on its fins and elevons flare out for transonic stability and close up for landing, where they would cost L/D. The X-24A has eight movable surfaces, biased automatically with Mach number (p. 2).
The internal systems are largely common to all three: a fully irreversible dual-hydraulic control system with stability augmentation, an XLR-11 rocket of 8,000 lb thrust, and aluminium structure. Each is carried aloft under the wing of a B-52 (pp. 2–3).
Flight envelope expansionp. 3
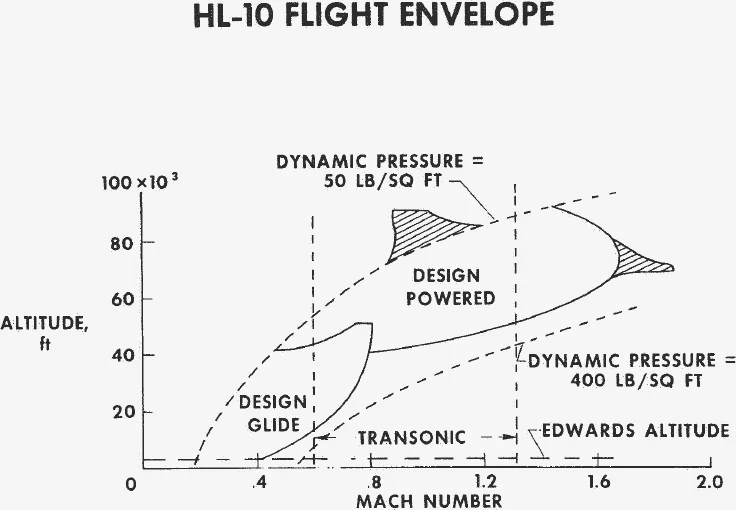
Each program began with glide flights launched at 45,000 ft and Mach 0.65–0.75, followed by powered flights to a high-speed, high-altitude point and a glide home. The envelope is bounded by a dynamic pressure of 50 lb/ft² below, where control effectiveness runs out, and 400 lb/ft² above, the structural limit. The HL-10 exceeded its design envelope, reaching about Mach 1.85 and 90,000 ft. A ground simulator built from wind-tunnel data was used before every program and updated with flight data as it went (p. 3).
Progress and status of programpp. 3–4
NASA contracted Northrop for the M2-F2 and HL-10 in June 1964. The M2-F2 was delivered in July 1965 and the HL-10 in January 1966. The Air Force contract for Martin Marietta's X-24A followed in May 1966. The M2-F2 first flew in July 1966. On its second systems-check glide before powered flight, it made a gear-up landing at a speed in excess of 200 knots. It was repaired with a new centre vertical tail and returned as the M2-F3. The HL-10 first flew in December 1966. Its flow-separation problems then delayed the second flight by more than a year. Its first powered flight came in October 1968, and envelope expansion was complete by March 1970 (pp. 3–4).
| Vehicle | Glide flights | Powered flights | Pilots | Envelope reached |
|---|---|---|---|---|
| HL-10 | 14 | 22 | 5 (glide), 4 (powered) | α 30°, Mach 1.85 |
| X-24A | 9 | 5 | 2 | Mach 0.98 |
| M2-F2 | 16 | — | 4 | subsonic |
| M2-F3 | 1 | — | — | first glide |
| Total | 40 | 27 | 7 in all | 67 flights |
The column sums are ours; they match the report's 67 flights by 7 pilots. The HL-10 then carried a 1,500-lb landing-rocket system for powered-approach tests.
Description of a typical flightpp. 4–5
A ground controller watches radar plots of the B-52 and lifting body in plan and elevation and steers the bomber to the launch point. The lifting-body pilot takes over the countdown ten seconds before launch, drops, lights the rocket, then flies research manoeuvres during the glide. Controllers update the ground track by radio, although some flights were flown with no ground guidance to show the pilot could judge the energy himself. On final, an escort pilot calls out airspeed and height (pp. 4–5).
2. Stability and Control Derivatives of the Lifting Body Vehiclespp. 11–27
Derivatives were extracted by matching. Planned manoeuvres, such as a rudder doublet followed by an aileron doublet, excited the natural modes. An operator then adjusted the coefficients of the equations of motion on a hybrid computer until the simulated response overlaid the flight record on a cathode-ray tube: an error-minimizing match, weighted by the operator's judgment (p. 13). All derivatives are in body axes. For example, is the directional stability, the dihedral effect, and the yawing moment produced by aileron.
Longitudinal characteristicspp. 13–14
Pitch was the easy axis. For all three vehicles the flight values of pitch-control effectiveness and static stability ran at or above the tunnel predictions, enough to shift the trim elevator setting but little else. The HL-10 has considerably higher pitch stability and control power than the M2-F2. Combined with the low stick gearing chosen for trim range, this gave pilot-induced-oscillation tendencies in the flare. Predicted pitch damping was −0.3 to −0.4 per radian. Flight values were generally higher, and pilots consistently found the real vehicles better damped than the simulators (p. 14).
The HL-10 alone flew supersonically. At an angle of attack near 14°, its static stability fell sharply between Mach 1.0 and 0.9. That brought a nose-up trim shift, which worried pilots because of how fast it arrived as the vehicle slowed through Mach 1 (p. 14).
Lateral-directional characteristicspp. 14–17
Lateral-directional behaviour was the harder axis. All three shapes combine low aspect ratio, low roll inertia and big vertical surfaces. That gives acceptable directional stability but very high dihedral effect and weak roll control by conventional standards (p. 15).
- HL-10: the lowest dihedral effect of the three and the most effective ailerons. Its aileron yaw was favourable, so it needed no rudder-to-aileron interconnect. Lateral handling was good and it was the least upset by turbulence.
- M2-F2: much higher dihedral effect, plus large adverse aileron yaw, produced roll reversal over the whole envelope and made the interconnect essential. The roll-subsidence and spiral modes coupled into a lightly damped oscillation, the coupled roll-spiral mode, that invited pilot-induced oscillation on the preflare approach. The M2-F3's fixed centre fin made the aileron yaw favourable (proverse). It then flew satisfactorily without the interconnect.
- X-24A: dihedral as high as the M2-F2's, directional stability that falls with angle of attack (and turns negative at transonic speed and high α), and the lowest aileron effectiveness of the three. Tunnel data put the aileron yaw near zero; flight showed it slightly favourable. That forced substantial changes to the interconnect, dampers and surface rates.
Transonically, the HL-10 went into a divergent Dutch roll three times, near Mach 1.2 above 20° angle of attack, each time recovered by lowering the nose. The X-24A's went negative between Mach 0.8 and 1.2 at α ≈ 14°, traced to separation over the tip fins. The high dihedral kept it statically stable all the same (p. 17).
3. Assessment of Lifting Body Vehicle Handling Qualitiespp. 29–41
With dampers on, HL-10 pilots gave Cooper-Harper ratings of 2 to 3 in the transonic configuration and 2 to 2.5 in the subsonic one: minimal compensation needed. With dampers off, ratings were 4 to 5, but all the pilots thought it completely flyable that way. A frequent comment: the HL-10 dampers-off handles better than an F-104 airplane with its dampers off. Zero lift occurs at 4° to 6° angle of attack (pp. 30–31).
- Configuration change. Simulators predicted a large trim upset when the HL-10's flared surfaces closed. In flight the pilot held α constant through the 5-second change, and one continuous motion worked best (p. 32).
- Transonic pitch-up. The X-24A's trim change came between Mach 0.97 and 0.96, much more abruptly than predicted. Pilots learned an angle of attack that minimised it (p. 32).
- Thrust trim. The X-24A pitched nose-up with rocket thrust. That would take a 7-inch thrust misalignment, but less than 2 inches was measured; the upward-deflected rooster tail exhaust plume is suspected (pp. 32–33).
- Gear transient. Extending the gear pitched the M2-F2, M2-F3 and X-24A nose-down; one early M2-F2 touchdown came less than a second after extension. We do not like extending the gear 20 feet above the ground (p. 33).
- Stick gearing. The HL-10 first had about 60° of elevator for 9 inches of stick. Flight showed 38° was enough, and a nonlinear gearing gave the approach almost 2 inches of stick instead of under 1 (p. 33).
On the lateral side, the X-24A was flown repeatedly past the boundary (zero body-axis directional stability) with no perceptible change, because high dihedral raises the effective dynamic stability . The coupled roll-spiral mode, a low-frequency, lightly damped lateral phugoid, was judged dangerous on the simulator and deliberately avoided in flight (pp. 34–35).
Simulation was generally accurate, yet each vehicle showed early handling problems it had not predicted. In the approach and landing, pilot gain is far higher than on a fixed-base simulator. The cure was in-flight simulation: F-104s configured to lifting-body L/D flew more than 6,000 practice approaches for the program (p. 36).
4. Performance Characteristics of the Lifting Body Vehiclespp. 43–58
Jon Pyle and Lawrence Ash compare flight-measured lift and drag with full-scale tests of the actual vehicles and with small-scale models. All drag data are trimmed, about a common centre of gravity. Small-model drag was corrected to flight Reynolds number with the Kármán–Schoenherr skin-friction law and for compressibility with the Sommer–Short reference-temperature method (p. 45). The quantities are the usual ones, with the body planform area:
is dynamic pressure, the zero-lift drag coefficient and the drag-due-to-lift factor (symbols, pp. 43–44). The last relation, for the glide angle of an unpowered vehicle in steady flight, is not printed in the paper but underlies all of the approach work that follows.
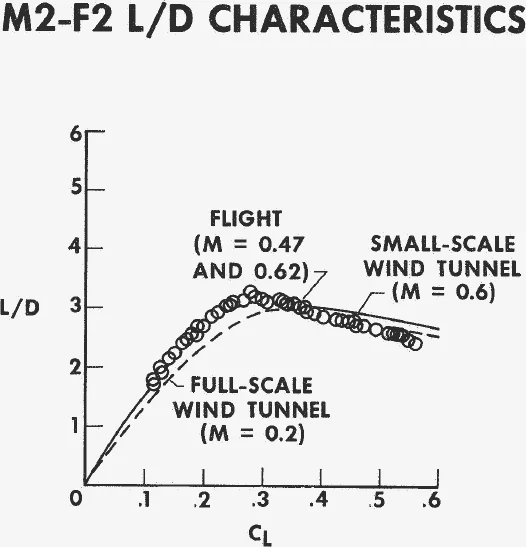
M2-F2. Flight data at Mach 0.47 and 0.62 coincide, so Mach number did not matter. At low lift, flight drag agrees with the small model but is much lower than the full-scale tunnel's, and the support struts are suspected. Above ≈ 0.3, flight drag-due-to-lift is higher than predicted. agrees fairly well, but occurs at a different (p. 45).
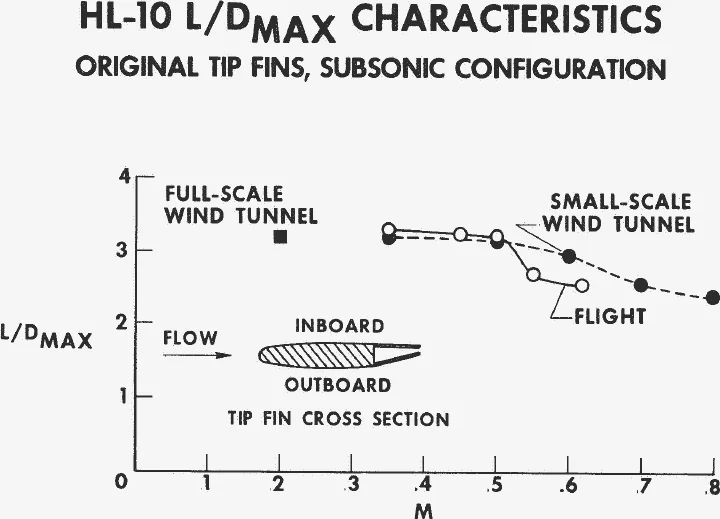
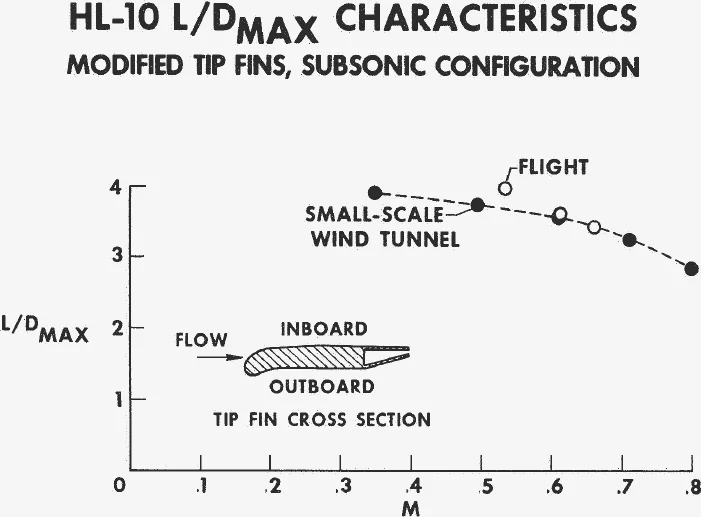
HL-10. On the first flight, L/D fell abruptly above Mach 0.5. It had not been anticipated: the small model showed only a gradual loss. The cause was a severe flow separation over the inboard surface of the tip fins, which also changed stability, control effectiveness and drag. Drooping and extending the fins' leading edges kept the flow attached. Compared at Mach 0.55, the modified HL-10's is approximately 35 percent higher. Detecting the problem in the early tunnel tests would have saved almost 15 months between the first and second flights (pp. 45–46).
X-24A. Low-lift drag agrees across all three sources. Here, unusually, the full-scale tunnel overpredicted . Its declines gradually with Mach number. Severe separation was never a problem, probably because its drooped fin leading edges were designed in from the start (p. 46).
| Configuration | Tunnel | C_D0 | Drag-due-to-lift factor |
|---|---|---|---|
| M2-F2 | full-scale | flight 28 % lower | flight higher |
| HL-10 original | full-scale | flight 23 % lower | flight higher |
| X-24A, δu = −13° | full-scale | same | flight higher |
| X-24A, δu = −21° | full-scale | flight 16 % lower | flight higher |
| M2-F2 | small-scale | flight 3 % lower | flight higher |
| HL-10 original | small-scale | flight 23 % higher | flight higher |
| HL-10 modified | small-scale | flight 5 % lower | flight higher |
| X-24A | small-scale | same | flight higher |
δu is the X-24A upper-flap setting. The original HL-10 is the one case where flight drag exceeds the small model's; the report notes that model did not predict the separation met in flight. The paper suspects buoyancy and strut interference in the full-scale tunnel, and notes that M2-F1 flights matched at the tunnel's own Mach and Reynolds numbers showed the same pattern, so Mach number does not explain it (p. 47).
Three further results. Lift and drag proved extremely sensitive to small changes in body contour and control surface settings, so models must match the flight vehicle closely (p. 48). The blunt base carries a large share of the drag. On the HL-10 the ratio of base drag to zero-lift drag jumps when the transonic flares open at Mach 0.6, and a model sting may raise the measured base pressure near that Mach number (p. 48). Finally, a sand-and-glue ablated surface on the full-scale X-24A, and a genuinely ablated coating on a related model, cost 20 to 30 percent of plus some pitch stability. The authors attribute losses this large to separation aggravated by the roughness, rather than to friction alone (p. 49).
5. Correlation of Flight-Test Loads with Wind-Tunnel Predicted Loads on Three Lifting Body Vehiclespp. 59–72
Ming Tang's strain gauges measured outboard-fin loads on the M2-F2 and X-24A, centre-fin loads on the HL-10 and X-24A, and hinge moments on every control surface. The fin load splits into components. The largest is , the load at zero angle of attack, sideslip and deflection. It comes purely from the flow around the body: about 0.6 on the M2-F2 in both flight and tunnel. It then grows with angle of attack, like a lift curve, until the flow separates, and in flight it separated at a lower angle than in the tunnel (p. 61).
| Vehicle | Component | Flight | Full-scale tunnel | Small-scale tunnel |
|---|---|---|---|---|
| M2-F2 | C_Yβ (sideslip) | 0.029 | — | 0.037 |
| M2-F2 | C_Yδr (rudder) | 0.013 | — | 0.013 |
| M2-F2 | C_Yδu (upper flap) | 0.005 | — | — |
| M2-F2 | C_Yδl (lower flap) | 0.003 | — | 0.002 |
| X-24A | C_Yβ (sideslip) | 0.032 | 0.029 | 0.035 |
| X-24A | C_Yδrb (rudder bias) | 0.018 | 0.028 | 0.027 |
| X-24A | C_Yδu (upper flap) | 0.010 | 0.011 | 0.010 |
| X-24A | C_Yδl (lower flap) | 0.003 | 0.005 | — |
Dashes are blanks in the report's tables. The X-24A flight came out about 0.1 higher than the tunnel's. Per-degree units are implied but not stated in the tables.
The hinge moments tell the story of the HL-10's first flight. With separated flow, the inboard-fin-flap hinge moment oscillated with a peak-to-peak amplitude equal to 10 percent of its design-limit load. After the fin modification the flow was steady (p. 62). Rocket thrust raised the base pressure and reduced hinge moments on all four aft HL-10 surfaces, an effect first seen at Mach 1. It appeared at Mach 0.9 on the X-24A (p. 63). The X-24A's small model, with many pressure orifices and accurate scaling, predicted its hinge moments especially well (p. 64).
6. Pilot Impressions of Lifting Body Vehiclespp. 73–88
Approach and landingpp. 74–77
Bill Dana: for the lifting bodies, approach manoeuvring is synonymous with terminal energy management. The pattern came from the X-15. The vehicle arrives at high key, over the touchdown point on the runway heading, and turns 180° to low key. Turning approaches allow precise positioning and better pilot judgement, and add turn rate as an energy control. A comfortable 360° pattern needs about 35,000 ft at high key, too much for glide flights launched at 40,000–45,000 ft, so the program standardised on a 180° approach from low key at 20,000 ft (p. 74).
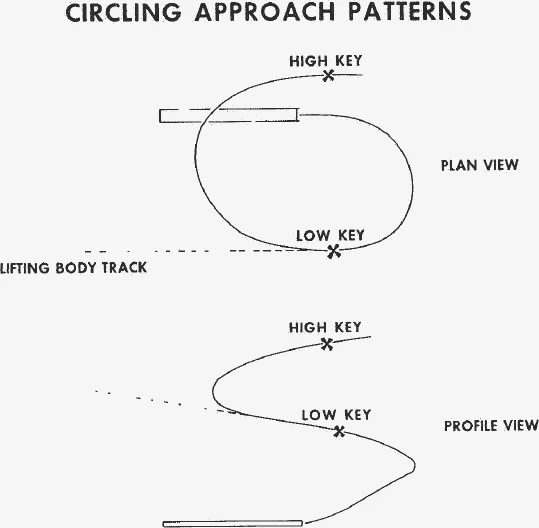
On powered HL-10 flights the transonic flares had to close at Mach 0.7 or below. The closing point, the ground track (240° overhead patterns were typical, sometimes 180° or 420°), airspeed and speed brakes were the energy controls. Every pilot flew the high-speed side of the L/D curve. There, diving off energy steepens the path and pulling up shallows it. On the back side those instincts would be wrong (p. 75).
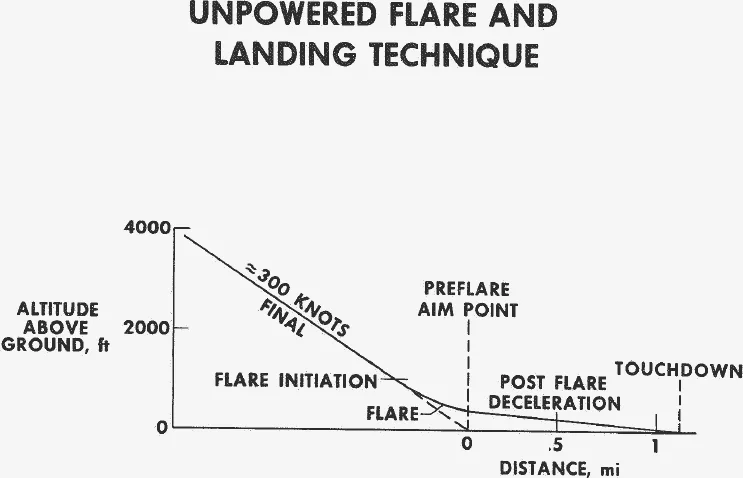
The numbers (p. 75): a final at 270–300 knots indicated, held down to 1,000 ft above the ground; a flare of about 1.5 g to level flight at 100 ft; gear extension at 220–240 knots; then a gradual descent to touchdown, at indicated speeds of 155 to 223 knots.
Jerauld Gentry defended the steepness. A slow, shallow approach would leave almost no float time after the flare to adjust sink rate, and little g available to flare at all. A steep, fast one costs a more demanding flare but buys float time and margin. The gear was changed from a 5-second airload-and-gravity extension to a pneumatic one taking a little over a second, so L/D stays high until just before touchdown. His analogy is dive bombing: the steeper the dive, the more accurate the delivery. Hence an approach of 10° to 25° (pp. 75–76).
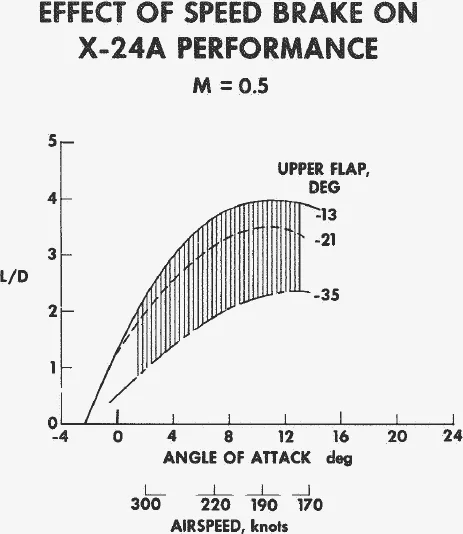
Speed brakes, said Gentry, can be used like engines to vary the pattern, at minimal weight and no fuel. Over about 30 recent flights aimed at a preselected spot on the runway, the average miss was less than 250 ft, and the vehicles stopped in a mile or less (p. 76).
Field of viewpp. 77–78
The HL-10's flush canopy gave only 16° of downward view to the right. Its lenticular Plexiglas nose window acted as a demagnifying lens near the ground, so pilots felt higher than they were and extended the gear late: Dana calls it the vehicle's single most unattractive design feature. Looking out over the high canopy rails meant rolling up to 18°/s to check position, against about 8°/s otherwise. The M2-F3's bulged canopy gave 21° of side view, and Gentry rated the X-24A's bubble canopy best by far (pp. 77–78).
Stability considerations; vehicle riding qualities, including effects of turbulencepp. 78–80
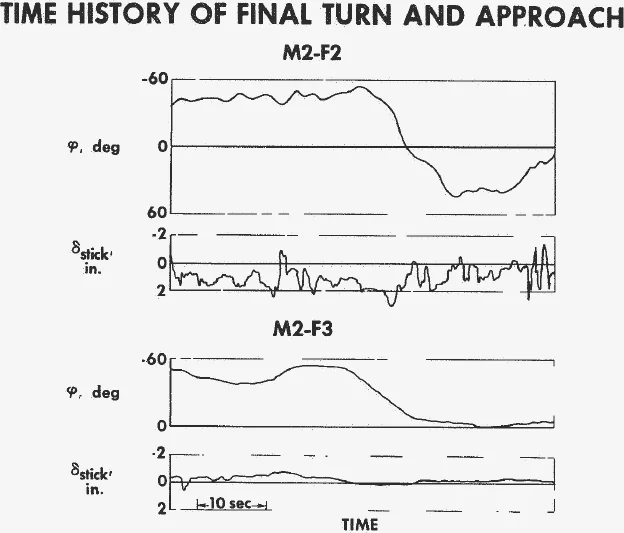
(Two headings, merged here.) The M2-F2's roll reversal needed a rudder-to-aileron interconnect. When the gain was high enough for good roll control at high angle of attack, it aggravated pilot-induced oscillation at the low angles used on approach. That region was entered on four flights, and an inadvertent entry contributed to the M2-F2 crash in 1967. The M2-F3's third fin fixed the stability itself, and the pilots' lesson is to design stability in rather than augment it in (p. 79).
Turbulence caused anxiety out of proportion to the upsets involved, felt mainly as lateral jolts in vehicles with little roll damping. The first X-24A flights used a −21° upper flap and simulator-chosen gains. Its proverse aileron yaw destabilised the Dutch roll at high dynamic pressure, until the yaw gain was raised, the roll gain cut, and the flap reduced about 8°. That gave the same approach speeds on a shallower path (p. 80).
7. Summary of Primary Results of the Lifting Body Programpp. 89–97
Garrison Layton restates the aims (prove the class can fly and land, check tunnel predictions through the transonic range, find unpredicted problems) and the results: the vehicles are flyable with enough performance for a safe power-off landing, predictions were generally good, and some problems were unforeseen. The original goal had been entry craft 20 to 30 ft long, at 35–50 lb/ft², carrying up to 10 or 12 passengers (pp. 90–91).
- Differences between predicted and flight L/D of up to 10 percent were seen. On a steep front-side approach, where airspeed is the vernier on glide angle, they hardly matter. On a powered, shallow approach at , a 10 percent L/D error is directly a 10-percent error in installed thrust and fuel consumption (pp. 91–92).
- Pilots put an of about 3.0 near the minimum for normal unpowered operations, from M2-F2 experience. The HL-10, with more than 4.0 at approach Mach numbers of 0.45–0.55, was good for normal operations. Above 4.0 there was no obvious gain: a shallower path makes the aim point harder to judge (p. 92).
- Final approaches above Mach 0.6 and flare entries above 0.55 were common, so tailoring the shape for very low subsonic conditions (M < 0.3) is futile (p. 93).
- Unexpected aileron yaw was the general problem: more positive than predicted on the HL-10 (an unstable Dutch roll at Mach 1.2), slightly positive instead of the predicted slightly negative on the X-24A. Large aileron yaw of either sign is to be avoided (p. 93).
black-box control systems should not be relied on to correct fundamental vehicle aerodynamic deficiencies.Paper 7, Control Systems Implications, p. 94
The evidence given: a simulator with full freedom over gains, interconnect and even rate command improved the M2-F2 only marginally, while the simple centre fin completely solved it in flight. Layton also recommends one-quarter- to one-third-scale flight testing of the Shuttle shape, where problems can be fixed cheaply (pp. 92–94).
8. Approach and Landing Studiespp. 99–108
Session II turns to the Shuttle. Berwin Kock and Fitz Fulton first test the middle ground between an unpowered approach and a 3° airliner glide slope. The HL-10 was fitted with three hydrogen-peroxide rockets of 500 lb thrust each, burning for 90 seconds, to flatten its approach from about 18° to 6°. All three were needed for a 6° glide at 300 knots. Starting at 15,000 ft, the rockets were lit at 6,500 ft above sea level and shut off about 200 ft up. To be safe if they failed, 300 knots had to be held throughout, and the runway needed to be 7.5 miles long with a 3.5-mile overrun. Only Rogers Dry Lake qualified (p. 100).
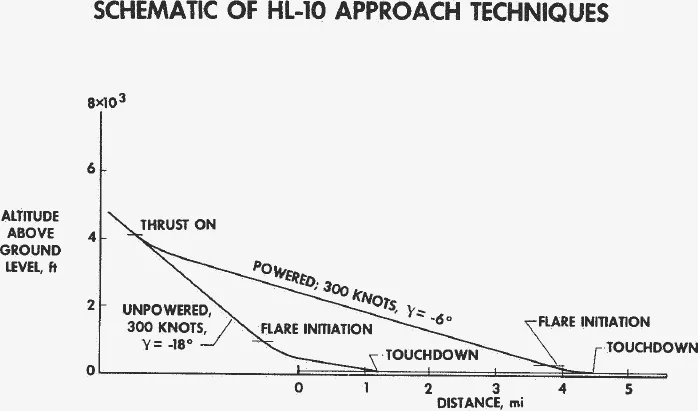
The conclusion was against the technique. The shallow aim point was harder to judge, the vehicle stayed faster near the ground, and the pilot had more contingencies to think about. A limited-duration rocket gave few of the benefits of power and most of the disadvantages (p. 101). Even with air-breathing engines, the Shuttle should be flown as if unpowered (p. 101).
To see whether a big vehicle could do it, a B-52 and a CV-990 flew simulated unpowered approaches at L/D of 3.1 to 4.5. The CV-990 used idle power, gear down, spoilers and 27° of flap for L/D up to 5, or 36° of flap for up to 8. High key was 20,000–26,000 ft, low key 10,000–15,000 ft, the approach about 17° and the flare 500–800 ft up. The pilots found the steep aim point easier to judge. In ten CV-990 landings aimed 2 miles past the runway end, too much speed and no speed brakes gave a 23-second float and one touchdown 2.7 miles out. Large vehicles need L/D modulation, and approach and landing speeds that match (pp. 101–104).
9. IFR Experience with Unpowered, Low-Lift-Drag-Ratio Landing Approachespp. 109–126
The Phase B Statement of Work called for an airline-type operation and Category II automatic landing, which implies instrument (IFR) approaches. Air Force engineers Peter Hoag and Lyle Schofield report three studies begun in 1969: ILS approaches in an F-111A, ground-controlled approaches (GCA) in an F-104, and GCA in the NB-52B (p. 109).
| L/D max | Nominal L/D | Configuration | Glide slope, deg | Airspeed, kt | Flare/hood removal, ft | Planform loading, lb/ft² |
|---|---|---|---|---|---|---|
| 8.0 | 6.6 | Λ = 26°, gear down | 8.1 | 250 | 200 | 58 |
| 5.5 | 5.0 | Λ = 50°, gear down | 10.1 | 285 | 450 | 55 |
| 3.7 | 3.7 | Λ = 72.5°, gear down | 13.6 | 270 | 800 | 48 |
| 6.1 | 5.3 | Λ = 72.5°, clean | 8.6 | 410 | 450 | 66 |
Λ is wing sweep. The 72.5°, gear-down case matches the HL-10 and X-24A in (p. 110). Approaches started from Mach 2.0 at 50,000 ft and were flown under a hood down to flare initiation (pp. 112–113).
The pilots found these hooded approaches less demanding than ordinary powered ILS approaches: higher speed meant better handling and stall margin, and on the speed-stable front side the glide slope could be corrected with pitch alone (p. 113). The F-104 flew GCA at L/D from 4.2 down to 1.9, on a 16° preflare glide slope at about 300 knots from an intercept 10,000 ft above the ground, flaring near 1,000 ft (pp. 113–114). The glide slope is earth-fixed but the glide is air-relative, so wind has to be compensated (p. 116). Their conclusion: unpowered low-L/D IFR approaches are practical and realistic (p. 119).
10. Rationale for Proposed Flying-Qualities Specificationspp. 127–146
Euclid Holleman reviews how far airplane flying-qualities rules stretch to the Shuttle. X-15 experience covers the low-dynamic-pressure phase: its reaction controls gave about 11°/s² in roll and 4°/s² in pitch and yaw, and pilots preferred rate or attitude command (pp. 128–129). In a fixed-base simulation, the HL-10's aerodynamics were scaled up from 6,400 lb to 250,000 and 500,000 lb. Unaugmented, the heavy versions were rated more satisfactory, because their slower response suited the HL-10's sensitive controls. With simple rate dampers, all sizes rated better than 3.5. A 500,000-lb vehicle stayed controllable on aerodynamic surfaces alone down to 20 lb/ft² (pp. 129–130). The proposal starts from the military Class III specification for large transports.
11. Final Remarks and Future Planspp. 147–151
Milt Thompson tells the audience what you should have concluded. High-cross-range shapes can have acceptable low-speed handling and enough performance for unpowered landings. Tunnel data, analysis and simulation are necessary, but flight testing is still essential: the team did everything it recommended and were caught short anyway. He proposes manned subscale Shuttle test vehicles and a quarter-scale, remotely piloted, B-52-launched model of the Manned Spacecraft Center orbiter configuration (pp. 147–148).
To us it seems ridiculous to maneuver to a position where power must be relied upon to reach the runway.M. O. Thompson, Paper 11, p. 149
He adds a caveat: designers may include landing engines, but should not plan to use them, since routine Category II operations are impossible on the fuel reserves contemplated. If all the other centres can get the Shuttle up and back through entry, we at the Flight Research Center can guarantee that it can be flown to the destination and landed safely (pp. 149–150).
Assumptions and open questions
Key assumptions
- Three research vehicles of about 6,000 lb and 22–24.5 ft stand for the whole class of lifting entry vehicles. Papers 7 and 10 carry the results to Shuttle size through scaled simulation, not flight (pp. 92, 129–130).
- Flight derivatives come from planned manoeuvres matched on a hybrid computer, with the operator's judgement weighting the fit (p. 13).
- Drag comparisons are made at trimmed conditions about a common centre of gravity. Small-model drag is adjusted to flight Reynolds number (Kármán–Schoenherr) and for compressibility (Sommer–Short) (p. 45).
- The approach technique assumes visual conditions, ground-controller advisories to low key, a chase pilot calling height and airspeed, and the very large landing area of Rogers Dry Lake (pp. 4–5, 74, 100).
- Large-vehicle and instrument approaches are represented by a B-52, CV-990, F-104 and F-111A configured to low L/D. The lifting-body pilots judged the patterns representative but the flares not (p. 102).
- Ablated-surface effects come from wind-tunnel tests: sand and glue on the full-scale X-24A, and an unscaled ablated coating on a subscale model (p. 49).
- The pilots are experienced test pilots, and the authors expect the same of the first Shuttle crews (pp. 77, 105).
Where further work would help
- Sensitivity to small aerodynamic changes. The papers report that handling depends strongly on aileron yaw (), and that lift and drag depend on small changes in contour and flap setting. Thompson asks for simulations that vary each derivative above and below its predicted value (p. 148). Mapping pilot ratings across such variations would show how much margin each conclusion has.
- Size and inertia. Frequencies and damping change by an order of magnitude between a 6,400-lb lifting body and a Shuttle-size vehicle (p. 92). The 500,000-lb results rest on fixed-base simulation. The manned subscale and quarter-scale vehicles proposed in Papers 7 and 11 are the flight tests that would extend them.
- Transonic and supersonic flight. At the time only the HL-10 had flown beyond Mach 1, and the X-24A had just met an unpredicted controllability problem near Mach 0.96 (p. 31). Envelope expansion of the X-24A and M2-F3 was the planned next step (pp. 94, 149).
- Landing accuracy. The average miss distance of less than 250 ft comes from about 30 visual flights onto a lakebed (p. 76). More flights in wind, onto paved runways and under instrument guidance would show how far that accuracy carries over.
- Wind. Glide slope is fixed to the ground but the glide is relative to the air. The IFR paper calls for more analysis and testing of wind compensation (pp. 116, 119).
- Base drag and surface roughness. The paper recommends base-pressure measurements on both models and vehicles, to separate sting effects (p. 48). Flight data on thermal-protection roughness would test the 20–30 percent L/D losses seen in the tunnel (pp. 49, 94).
- Turbulence. Experience of turbulence was limited to a few flights per pilot per vehicle (p. 79), and pilots felt accelerations at their seat that the centre-of-gravity data did not show (p. 80). Turbulence response prediction is flagged as deserving more attention.
- Air-breathing landing engines. The powered-approach conclusion comes from short-burn rockets on the HL-10. The authors note it may not carry over to a vehicle with air-breathing engines, about 10 minutes of fuel and a go-around capability (p. 101).
What happened next
- 1963
Aug 16: the lightweight M2-F1 makes the first lifting-body free flight, the start of the program this report summarises.
- 1970
Jul 8: weeks after the symposium, Manned Spacecraft Center director Robert Gilruth writes that studies supported by data from the Flight Research Center show the operational orbiter does not need air-breathing engines.
- 1970
Jul 17: the HL-10 makes its 37th and last flight. NASA later credited its flights with contributing substantially to the decision to build the Shuttle without air-breathing engines.
- 1971–72
The X-24A ends its 28 flights on 4 June 1971 and is rebuilt as the X-24B. The M2-F3 makes its last flight on 20 December 1972, reaching 71,500 ft.
- 1975
Aug 5: John Manke lands the X-24B on the Edwards concrete runway, the first lifting-body landing on a paved runway, touching down on a painted target line. The last powered lifting-body flight follows on 23 September.
- 1977
Feb 15 – Oct 26: the Shuttle Approach and Landing Tests with the orbiter Enterprise.
Sources
- NASA TM X-2101, Flight Test Results Pertaining to the Space Shuttlecraft (1970), NTRS · Public distribution
- C. Gelzer (ed.), NASA Armstrong Flight Research Center's Contributions to the Space Shuttle Program (NASA SP-2020-4322) · Timeline p. iii; ch. 5, pp. 43, 51–52
- NASA Armstrong Fact Sheet: Lifting Bodies
- NASA Image Library: X-24A, M2-F3 and HL-10 on Rogers Dry Lake, 1969
- NASA Image Library: HL-10 first flight landing, 22 December 1966